TSLA Stock Technicals Today: Gains 2.27%, Golden Cross Formed
On September 18, 2026: price 366.20 USD, trend uptrend, RSI 54.8, support 345.13, resistance 376.37. technical analysis of tsla stock. TSLA Stock Technicals —…

Tesla’s shares rose to 366.20 USD on NASDAQ in New York, extending a short-term uptrend after the stock closed at 358.08. The move matters because it happened with the price holding above both the 20-day and 50-day averages, a sign that buyers are still controlling the tape rather than merely reacting to a one-day bounce.
Trend & Price Action
The chart shows TSLA trading in a constructive position: 366.20 USD sits above the SMA20 at 358.64 and the SMA50 at 351.09, while the golden cross — where the 20-day average moves above the 50-day average — confirms that short-term momentum has improved relative to the medium-term trend. In plain language, that crossover often means recent buying has been strong enough to pull the stock into a more favorable trend structure.
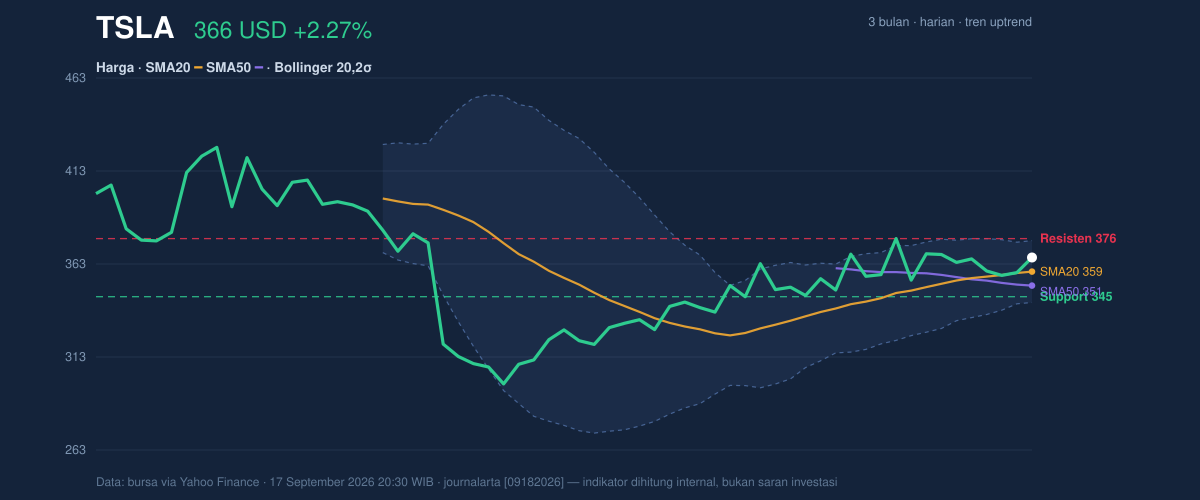
The slope of the SMA20 is rising at 1.35% over 5 days, which signals that the trend is not just above average, but still improving. The price is also sitting at 67% of the 20-hour range, a useful detail because it shows TSLA is closer to the upper half of its recent trading band without yet pressing into the extreme top. That leaves some room for continuation, but not much slack before resistance starts to matter.
The nearby ceiling is 376.37, with Bollinger-band resistance at 375.25. Those two levels are tightly aligned, which is important: when price approaches a cluster like this, it often becomes a test of whether the move has real sponsorship or is simply drifting higher on moderate enthusiasm. On the downside, 345.13 is the first clear support from the 20-hour range, and it sits below the 20-day average, making it the level that would tell traders the recent breakout structure is fading.
Oscillators & Momentum
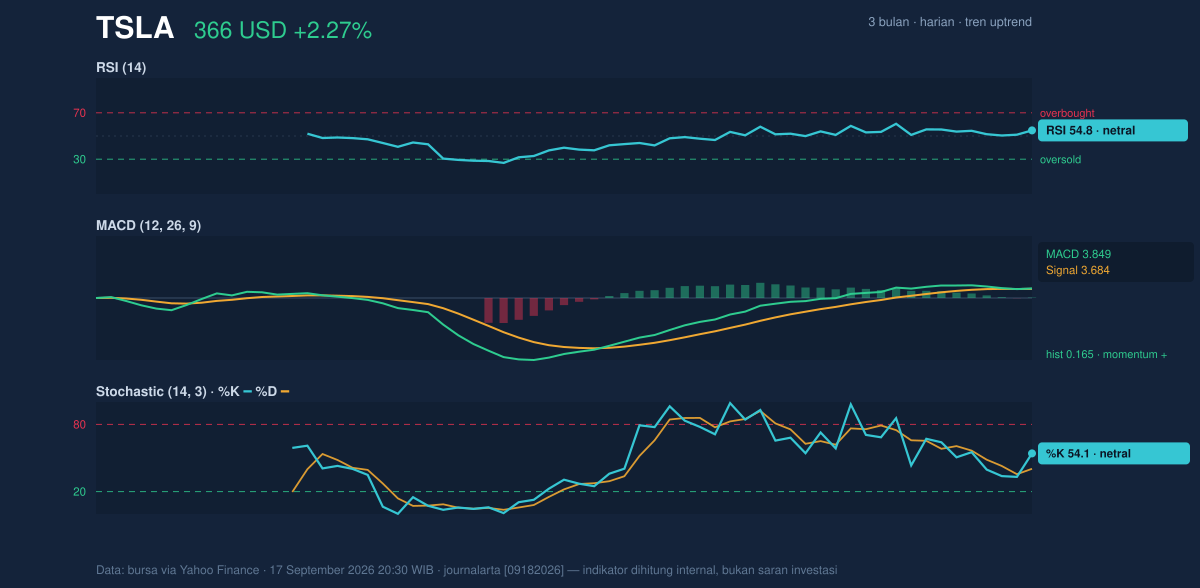
Momentum is positive, but not stretched. RSI at 54.8 is neutral, which means the stock is neither overbought nor oversold and still has room to move without immediately triggering a classic exhaustion signal. The Stochastic %K at 54.1 and %D at 40.4 also sit in neutral territory, but the gap between them suggests the short-term momentum line is still improving. That is a subtle bullish sign: it implies the rebound has not run too far ahead of itself.
The MACD at 3.849 remains above the signal line at 3.684, with a positive histogram of 0.165. This matters because MACD is designed to show whether trend momentum is accelerating or fading. A positive histogram means the faster-moving line is still ahead, so upward pressure remains in place even if the stock is not surging. The message from the oscillators is therefore consistent: TSLA is advancing, but without the kind of overheated readings that often precede sharp reversals.
Volatility & Volume
Volatility is not low. ATR(14) at 14.46 equals 3.9% of price, which means daily swings can be wide enough to push the stock through nearby support or resistance quickly. For readers, ATR is a measure of typical movement, and a higher reading usually means wider intraday ranges and less predictable closes. That makes the current setup more tactical than sleepy.
The Bollinger Bands add another layer. Price is trading with %B at 73%, which places it in the upper part of the band structure but not at the very top. The band width is 9.3%, described as normal, so this is not a squeeze setup where an explosive move is being tightly coiled. Instead, it suggests a steady trend environment where price can grind higher, but also where a failure near the upper band could invite a pullback toward the middle band at 358.64.
Volume does not yet confirm a breakout. Last volume was 38,828,500, roughly 1.0x normal versus the 20-day average of 39,422,020. That is enough to show participation, but not enough to call it a volume-led surge. Still, OBV is rising, and that is important because On-Balance Volume tracks whether volume is generally accumulating on up days. Rising OBV alongside a price trend suggests underlying demand is still present, even if the latest session was not unusually heavy.
Key Levels & Scenarios
The 3-month range frames the larger battle: 432.86 is the upper boundary, while 297.38 marks the lower end. TSLA is now well above the midpoint of that range, which tells us the stock has recovered meaningfully from prior weakness, but it is still below the kind of zone that would suggest a full-range recovery.
The immediate question is whether the stock can clear the resistance cluster at 375.25 to 376.37. If it does, the chart would likely shift from a recovery phase into a stronger continuation phase, with the upper Bollinger band no longer acting as a lid. If it fails there, the most natural pullback area is the middle band and SMA20 at 358.64, followed by 345.13 if sellers gain traction. Because ATR is elevated, those levels could be tested quickly rather than gradually.
Technical Verdict: HOLD (wait & see)
HOLD (wait & see) — the trend is positive, but price is now pressing into a resistance cluster that has not yet been decisively cleared.
- Golden cross and price above SMA20/SMA50: trend structure favors buyers.
- MACD positive with a rising histogram: momentum is still supportive.
- RSI 54.8 and %B 73%: constructive, but close enough to resistance that confirmation is still needed.
Verdict invalidated if price falls below 345.13, which would weaken the short-term structure and put the 20-day average back under pressure.
- Ideal Entry Range: 358.64 to 366.20
- Exit Target: 375.25 to 376.37
- Stop Loss protection: 345.13
For non-traders, this means TSLA’s chart is improving, but the next move still needs proof at resistance before the trend can be treated as more than a solid rebound.
Summary Data TSLA
| Last price | 366.20 USD |
| Change 1 day / 5 days / 1 month | 2.27% / 0.73% / 4.29% |
| Trend / MA-cross | uptrend / golden |
| SMA20 / SMA50 | 358.64 / 351.09 |
| RSI (14) / Stochastic %K | 54.8 / 54.1 |
| Bollinger %B / ATR | 73% / 14.46 |
| Support / Resistance 20 days | 345.13 / 376.37 |
| Data as of | 17 September 2026 20:30 WIB |



