AVGO Stock Gains 2.29%, Momentum Weakens In Focus
On September 18, 2026: price 347.30 USD, trend downtrend, RSI 38.1, support 339.27, resistance 371.54. technical analysis of avgo stock.

Broadcom is still carrying the weight of a broad pullback, with the shares trading at 347.30 USD after a 2.29% rise on the day, but the broader message from the chart is that the rebound is happening inside a weakening structure. For international readers, that matters because AVGO is not just a semiconductor name; it is also a read on how investors are pricing demand, margin resilience, and risk appetite across US technology.
Broadcom’s latest move came after a weak stretch: the stock is down 3.75% over 5 days and 4.19% over 1 month, according to Yahoo Finance data cited on 17 September 2026 at 20:30 WIB. The price is still sitting below SMA20 at 359.64 and well below SMA50 at 380.63, which means the shorter-term and medium-term trend are both leaning lower. As shown in the chart, the stock is also trading in the lower part of its recent range, at about 25% of the 20-hour support-resistance band. That positioning usually signals that sellers still control the tape, even when there is a daily bounce.
Trend & Price Action
The most important signal is not the one-day gain; it is the slope of the trend. The data shows a downtrend with the SMA20 falling 2.88% over 5 days, which means the average price over the last month is still rolling over. When a stock trades below both its 20-day and 50-day moving averages, rallies often behave like tests of overhead supply rather than clean trend reversals. In plain terms, investors who bought higher may use strength to reduce exposure, and that can cap advances.
There is no fresh moving-average crossover to suggest a new trend shift. That matters because a crossover is often the first mechanical sign that momentum is changing direction. Without it, the chart remains in a repair phase rather than a recovery phase.
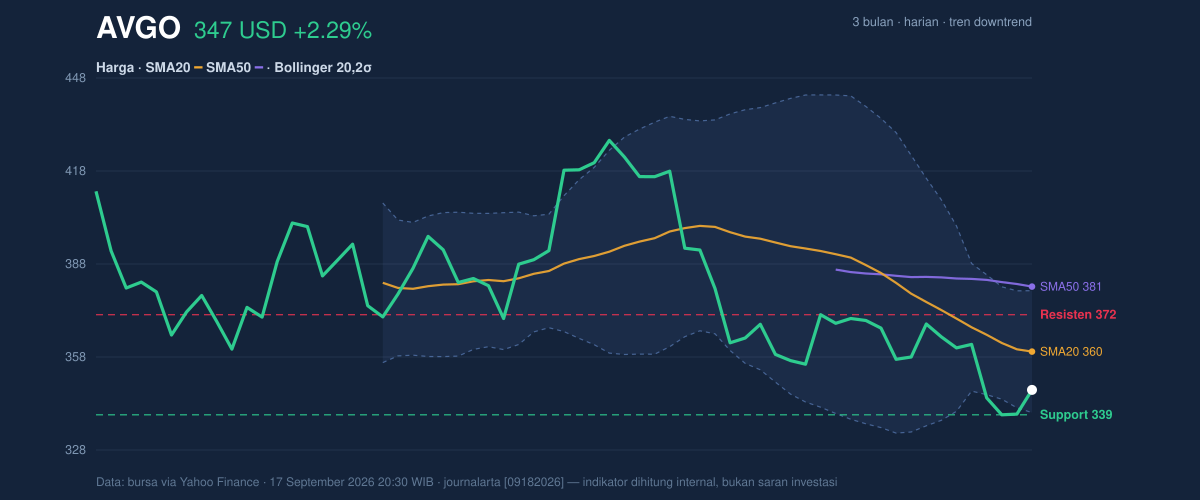
The nearest support is 339.27, just below the current price, while resistance sits at 371.54. Broadcom is also trading just above the lower Bollinger band at 339.97, which tells us the stock is near the edge of its recent statistical range rather than in the middle of it. That does not guarantee a bounce, but it does explain why the latest daily move can exist even while the broader trend remains fragile.
Oscillators & Momentum
Momentum is mixed, and that is the key nuance. The RSI at 38.1 is neutral, but it sits closer to the lower end of the range that often accompanies weak price action. RSI is a gauge of whether a stock has been overbought or oversold; at this level, Broadcom is not washed out, but it is not showing strong buying pressure either. The Stochastic %K at 28.2 and %D at 13.6 also read as neutral, though the low %D suggests the stock has been in a softer phase and is trying to stabilize.
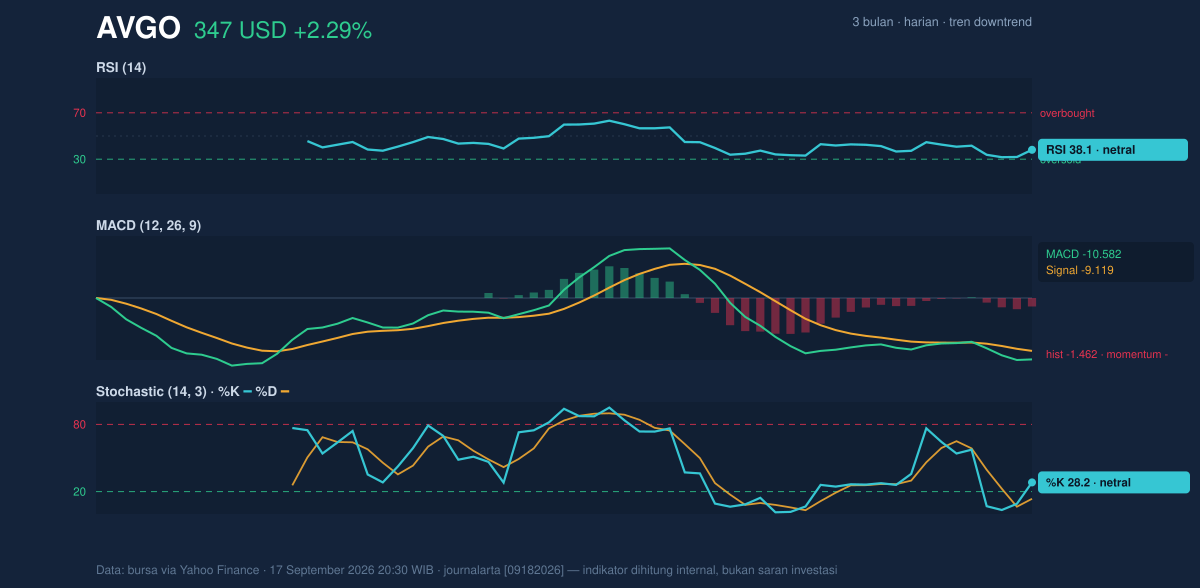
The more cautionary signal comes from MACD. Broadcom’s MACD is -10.582, below its signal line at -9.119, with a histogram of -1.462. MACD compares short- and medium-term momentum; when it is negative and below the signal line, it usually means downside momentum still has the upper hand. The histogram staying negative reinforces that the move is not yet confirmed as a durable reversal. In other words, the bounce is real, but the momentum engine is still running in reverse.
Volatility & Volume
Volatility is present, but not extreme. The ATR(14) at 10.69, or 3.1% of price, indicates a market that can move meaningfully without turning chaotic. ATR is a measure of how much the stock typically moves in a day; at this level, traders should expect room for intraday swings, but not panic-style gaps as the base case.
Bollinger Bands add another layer. The band width is 10.9%, described as normal, so this is not a squeeze that often precedes a sharp breakout. The %B reading of 19% shows the stock is hugging the lower part of the band structure, which usually means price is closer to the downside boundary than the upside boundary. That is consistent with the broader downtrend and helps explain why the chart still favors caution.
Volume does not yet confirm a strong reversal. Last volume was 24,351,200, roughly 1.0× the 20-hour average of 25,616,675. In practical terms, that is participation, but not conviction. The OBV is falling, and OBV, or on-balance volume, is a way of tracking whether volume flow supports price. A declining OBV says sellers have been more effective than buyers over time, even if the latest candle is green.
Key Levels & Scenarios
The immediate technical map is clear. 339.27 is the first level to watch on the downside, and it sits close to the 339.97 lower Bollinger band. If price fails to hold that area, the market would be signaling that the recent weakness is not just a shallow pullback. On the upside, 371.54 is the first meaningful resistance, and it lines up with the idea that any rally has to clear a zone where prior sellers may reappear.
The stock’s 3-month range also frames the story. The 3-month high is 432.73 and the 3-month low is 335.81. That means Broadcom is trading much closer to the low end of the recent range than the high end, which is another sign that the market has not yet re-rated the shares back into a stronger trend.
Technical Verdict: HOLD (wait & see)
HOLD (wait & see)
- MACD remains negative, and the histogram is still below zero, so momentum has not confirmed a durable turn.
- Price is below SMA20 and SMA50, while the SMA20 is still sloping down, which keeps the trend labeled as downtrend.
- %B at 19% and price near the lower band show weakness, but not yet a clean breakdown beyond the recent support zone.
Verdict invalidated if price falls below 339.27.
- Ideal Entry Range: 339.27 to 347.30
- Exit Target: 359.64 to 371.54
- Stop Loss protection: below 335.81
For non-traders, this means the stock is trying to stabilize, but the chart still needs proof before the trend can be called repaired.
The latest support level remains 339.27.
Summary Data AVGO
| Last price | 347.30 USD |
| Change 1 day / 5 days / 1 month | 2.29% / -3.75% / -4.19% |
| Trend / MA-cross | downtrend / none |
| SMA20 / SMA50 | 359.64 / 380.63 |
| RSI (14) / Stochastic %K | 38.1 / 28.2 |
| Bollinger %B / ATR | 19% / 10.69 |
| Support / Resistance 20 days | 339.27 / 371.54 |
| Data as of | 17 September 2026 20:30 WIB |



