Shell Stock Drops 1.83%, Golden Cross Formed In Focus
On Agustus 5, 2026: price 3,321.50 GBp, trend uptrend, RSI 68.9, support 3,011.00, resistance 3,405.50. technical analysis of shell stock.

Shell plc edged lower on the London Stock Exchange on 3 August 2026, with the shares last changing hands at 3,321.50 GBp after a 1.83% daily decline, even as the broader chart still points to an established uptrend. The pullback matters less as a standalone move than as a test of whether recent buyers are simply pausing after a strong run: the stock remains above its short- and medium-term averages, volume is running slightly above normal, and the longer structure has not yet been broken.
Trend & Price Action
The headline signal is that Shell is still trading in a constructive trend, not a broken one. As shown in the chart, the shares sit above both the SMA20 at 3,215.50 and the SMA50 at 3,130.26, while the golden cross — where the shorter average moves above the longer one — confirms that recent price strength has been broad enough to shift the moving-average structure in favour of buyers.
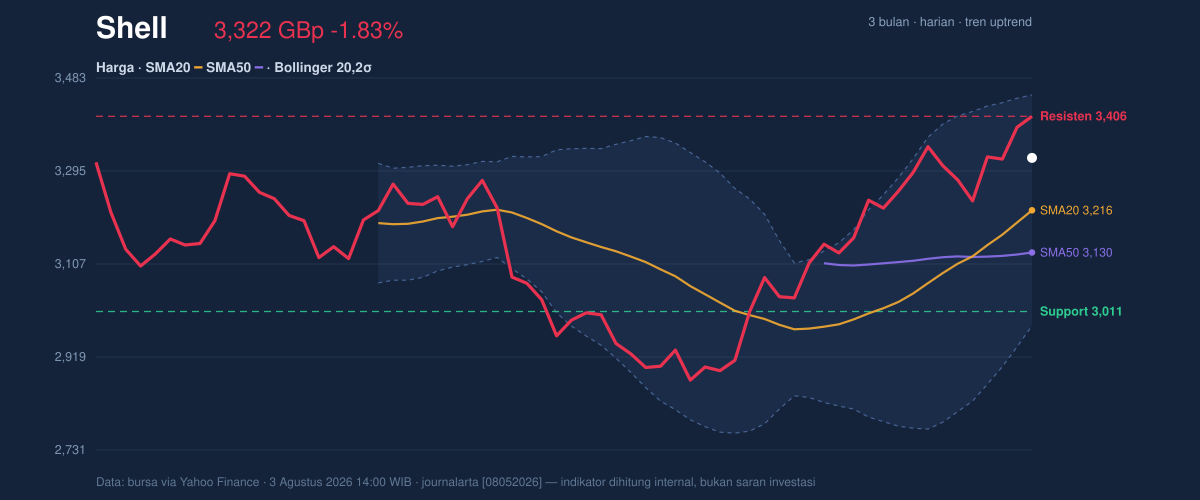
That matters because moving averages are not just lines on a chart; they are a shorthand for where the market has been willing to transact over different timeframes. With the price still above the SMA20 and the SMA20 itself rising at 3.47% over 5 days, the trend is showing positive slope rather than fading momentum. The stock is also positioned at 79% of its 20-day range, which means it is trading closer to the upper end of that recent band than the lower end. In plain language, the market is still pricing Shell near the stronger side of its recent range, even after today’s dip.
The broader context is equally important. The shares are well above the 3-month low of 2,559.50 and still below the 3-month high of 3,758.50, leaving room for both continuation and digestion. That is a healthy setup for a trend, but it also means the market is not yet in a clean breakout phase.
Oscillators & Momentum
Momentum is more mixed than the trend, and that is the key nuance in Shell right now. As shown in the momentum chart, the RSI at 68.9 sits in neutral-to-strong territory, close to the overbought line but not decisively stretched. By contrast, the Stochastic %K at 98.7 and %D at 95.5 are clearly overbought, which usually signals that the latest advance has moved quickly and may need a pause or a shallow retracement before the next leg higher.
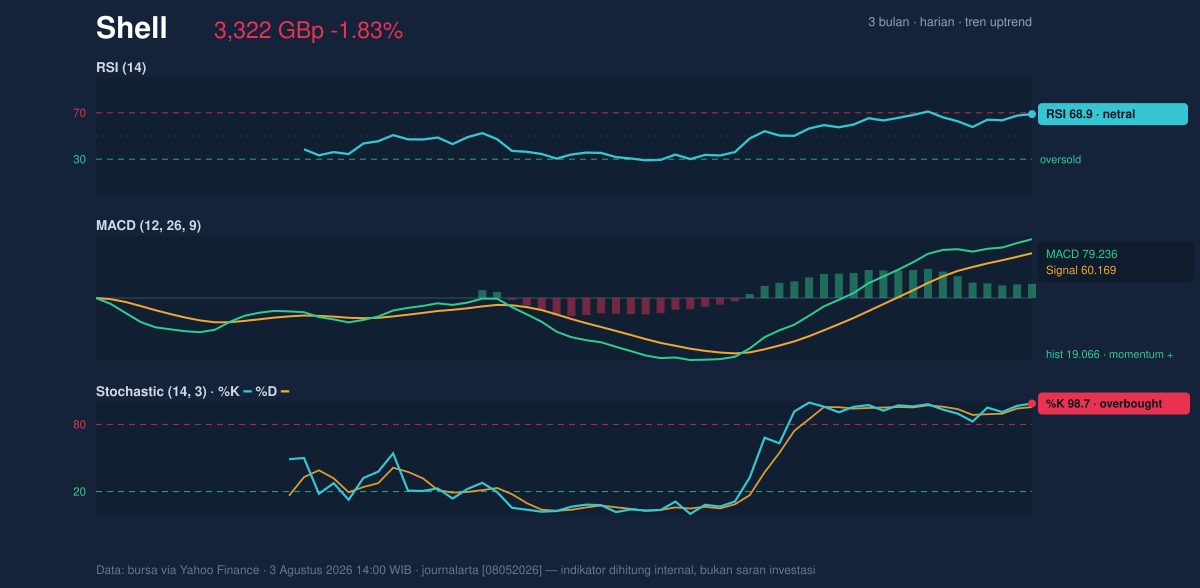
The MACD at 79.236, above its signal line at 60.169 with a 19.066 histogram, still supports positive momentum. In practical terms, MACD is saying the trend has not only persisted but is still being reinforced by recent price action. The tension here is that the fast oscillators are hotter than the trend indicators: that combination often appears near short-term inflection points, where bullish structure remains intact but near-term upside can become more selective.
That is why the chart should be read as “strong trend, stretched short-term momentum,” not as a one-way continuation signal. The market is still advancing, but it is advancing from a crowded part of the recent range.
Volatility & Volume
Volatility is contained rather than explosive. The Bollinger Band width of 14.5% is described as normal, which suggests the stock is not in a squeeze that would usually precede a sharp expansion, nor is it in an unusually wide, disorderly phase. The price sits at %B 73%, meaning it is trading in the upper portion of the Bollinger envelope, above the middle band at 3,215.50 but below the upper band at 3,448.67. That positioning reinforces the same message seen in the momentum data: the trend is positive, but the shares are not cheap relative to their recent statistical range.
Volume adds a useful confirmation. The latest turnover of 10,356,618 is about 1.1× the 20-day average of 9,093,775, and OBV is rising. OBV, or on-balance volume, tracks whether volume is flowing into up days or down days; a rising line generally implies accumulation rather than distribution. In Shell’s case, that helps validate the uptrend, because the price advance has not occurred on weak participation.
The ATR(14) at 73.68, or 2.2% of price, indicates moderate day-to-day movement. That is important because it frames how far the shares can reasonably move without the chart becoming disorderly. A moderate ATR also means the current pullback can be viewed as normal trading noise unless it accelerates through support.
Key Levels & Scenarios
The nearest support is 3,011.00 and the nearest resistance is 3,405.50. Those levels matter more than the day’s percentage change because they define the market’s current battleground. The price is still above support, but not far enough below resistance to claim a breakout. As a result, the stock is in a range where trend followers will want confirmation rather than assumption.
If Shell holds above the 3,215.50 SMA20 and pushes through 3,405.50 resistance, the chart would begin to look like a continuation of the golden-cross trend rather than a mere rebound. If it fails to hold the 3,011.00 support, the tone would shift more sharply, because that would put price back into the lower part of the recent range and weaken the case that the current uptrend remains in control.
Technical Verdict: HOLD (wait & see)
HOLD (wait & see)
- The golden cross and price above the SMA20/SMA50 keep the primary trend positive.
- MACD remains bullish, and OBV is rising, which supports underlying participation.
- The short-term oscillators are stretched: Stochastic is overbought, and RSI at 68.9 is close to the upper boundary, so near-term upside may be less clean.
Verdict invalidated if price breaks below 3,011.00.
- Ideal Entry Range: 3,215.50 to 3,011.00, with the lower end aligned to support and the SMA20.
- Exit Target: 3,405.50, with a stretch reference toward 3,448.67 if resistance gives way.
- Stop Loss Protection: below 2,982.33, the lower Bollinger band, or more conservatively just under 3,011.00 support.
In simple terms, Shell still looks technically firm, but the chart is asking for proof that the recent strength can continue without first cooling off. “It’s strong, but stretched — and that’s where the next move starts to matter.”
Summary Data Shell
| Last price | 3,321.50 GBp |
| Change 1 day / 5 days / 1 month | -1.83% / 1.36% / 14.04% |
| Trend / MA-cross | uptrend / golden |
| SMA20 / SMA50 | 3,215.50 / 3,130.26 |
| RSI (14) / Stochastic %K | 68.9 / 98.7 |
| Bollinger %B / ATR | 73% / 73.68 |
| Support / Resistance 20 days | 3,011.00 / 3,405.50 |
| Data as of | 3 Agustus 2026 14:00 WIB |



