Alibaba Golden Cross Formed: Stock Gains 2.32% (Agustus 6, 2026)
On Agustus 6, 2026: price 128.10 HKD, trend uptrend, RSI 67.4, support 107.50, resistance 125.80. technical analysis of alibaba stock. Alibaba Golden Cross…

Alibaba Group rose on HKEX on 4 August 2026, with 9988.HK last changing hands at HKD 128.10, above the previous close of HKD 125.20 as the stock extended a short, sharp advance that has already lifted it 14.38% over 5 days and 33.72% over 1 month. The move is notable not just for its speed, but for where it sits in the chart: the price is now trading above the short- and medium-term trend lines, while momentum indicators are beginning to warn that the rally is getting stretched.
Trend & Price Action
The broader message from the chart is constructive. Alibaba remains in an uptrend, and the slope of the SMA20 at 5.57% over 5 days shows that the near-term trend is still rising rather than flattening out. More importantly, the stock is trading above the SMA20 at HKD 113.94 and above the SMA50 at HKD 111.47, with a golden cross already in place, meaning the faster average has moved above the slower one. In plain terms, that is the classic technical sign that recent buying pressure has overtaken the longer trend.
The price is also pushing through the upper end of its recent range. The 20-hour support and resistance band sits at HKD 107.50 and HKD 125.80, and the stock is now trading at 113% of that range, which signals a breakout rather than a quiet consolidation. As shown in the chart, this is the kind of move that often follows a strong trend confirmation — but it can also leave the stock vulnerable to a pause if momentum cools.
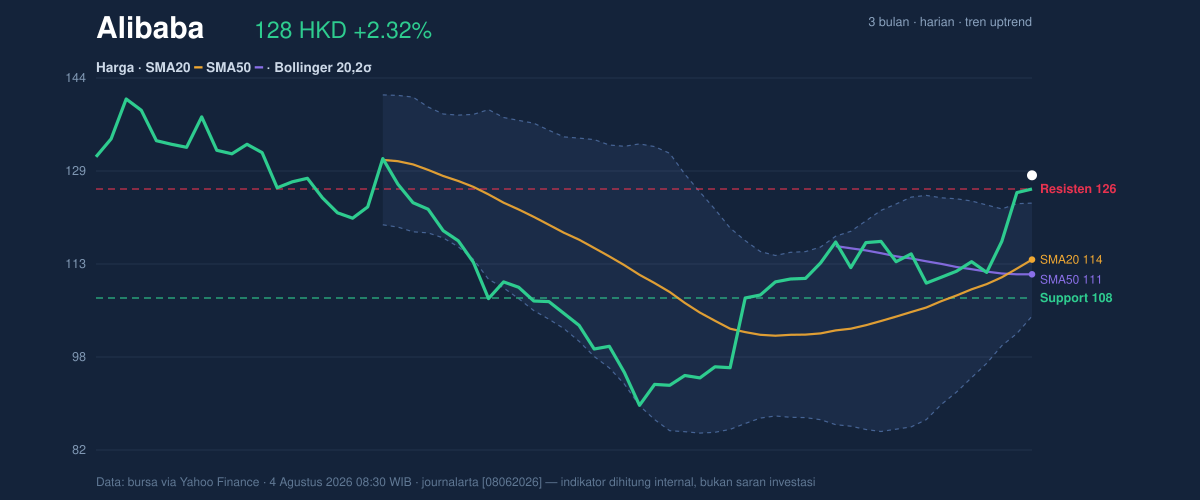
The wider 3-month frame adds context: Alibaba is still below the 3-month high of HKD 144.00, but comfortably above the 3-month low of HKD 88.65. That positioning matters because it shows the stock has already repaired a large part of its prior weakness, yet it has not fully retraced to the top of the range.
A strong trend, but no room for complacency.
Oscillators & Momentum
The momentum picture is mixed rather than uniformly bullish. The RSI(14) at 67.4 is described as neutral, but it is sitting close to the conventional overbought zone, which means the stock is not yet overextended by itself, though it is approaching the area where gains often become harder to sustain. More pointedly, the Stochastic %K at 83.8 and %D at 83.6 are both in overbought territory. That usually tells traders the recent rally has been fast enough to leave prices vulnerable to a short-term pullback or sideways digestion, even if the larger trend remains intact.
The strongest momentum confirmation comes from MACD at 3.070, above its signal line at 1.521, with a histogram of 1.549. That alignment means bullish momentum is still expanding, not fading. In technical terms, MACD is the trend-following indicator here: it says the upward move still has internal force behind it, even if oscillators are warning that the stock is getting hot in the near term.
As shown in the chart, the key nuance is that momentum is not turning down yet — it is simply becoming more mature.
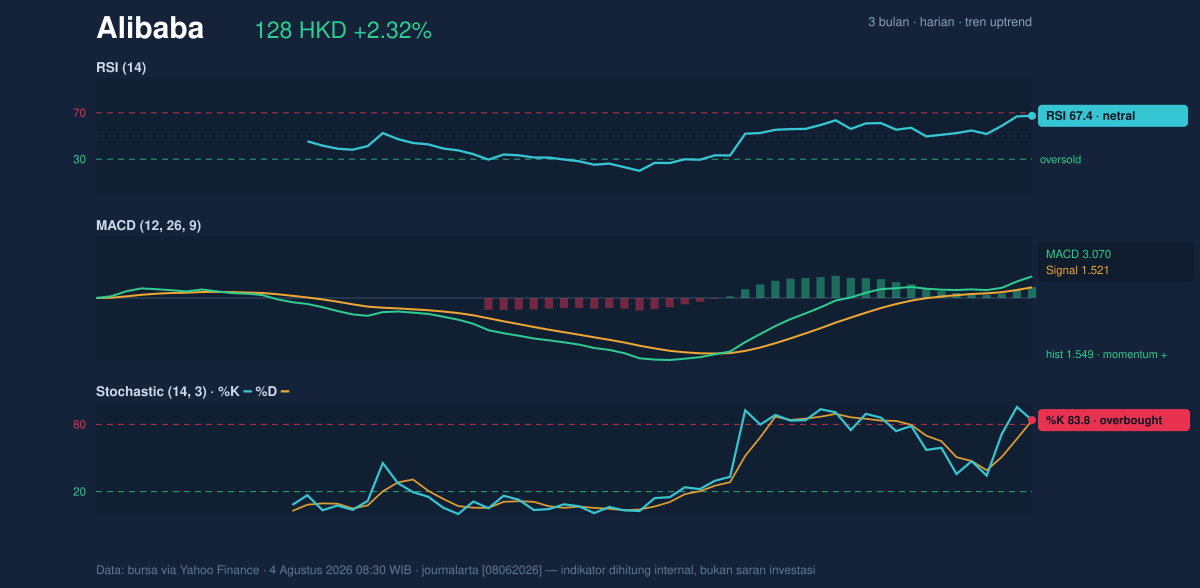
That combination often produces choppy price action: trend support from MACD, caution from Stochastic, and a market that may need to cool before it can extend further.
Volatility & Volume
Volatility is elevated. The ATR(14) of 5.46, equal to 4.3% of price, implies that Alibaba can move several Hong Kong dollars in a normal session without that necessarily changing the trend. For readers, ATR is a measure of typical daily movement; a higher reading means wider intraday swings and a greater chance of false breaks around support and resistance.
The Bollinger Bands add another layer. Price is above the upper band at HKD 123.43, with %B at 125%, which means the stock is trading beyond the usual envelope of its recent 20-day volatility. That is a strong sign of upside momentum, but it also suggests the move is stretched relative to the recent average. The band width at 16.7% is described as normal, so this is not a volatility squeeze likely to explode; instead, it looks more like an already-expanded trend that may need time to digest gains.
Volume does not yet show a dramatic surge. Last volume was 125,358,922, just above the 20-day average of 121,903,305, or about 1.0× normal. That matters because a breakout that is not accompanied by strong volume can still work, but it is less emphatic than one backed by heavy participation. The encouraging part is that OBV is rising, which means the balance of volume has been accumulating on up days. In other words, buyers have been willing to commit capital as the stock climbs.
Participation is supportive, but not euphoric.
Key Levels & Scenarios
The immediate technical battleground is clear. HKD 125.80 is the nearest resistance from the 20-hour range, and the stock has already moved just above that zone. If it holds above that level, the chart suggests Alibaba may attempt to build a new base above the breakout area. If it slips back below, the move begins to look more like an exhaustion push than a durable breakout.
On the downside, HKD 113.94 at the SMA20 is the first major dynamic support, followed by HKD 111.47 at the SMA50. A break below those averages would weaken the current bullish structure because it would show the stock losing the very trend lines that helped define the rally. The deeper reference point is HKD 107.50, the lower edge of the recent 20-hour support zone.
The chart suggests a simple conditional map: above HKD 125.80, the trend remains in control; back below the moving averages, the rally starts to lose authority.
Technical Verdict: HOLD (wait & see)
HOLD (wait & see)
- MACD remains positive, with the line above signal and a positive histogram, so the broader trend still has bullish momentum.
- Price is extended above the upper Bollinger Band and Stochastic is overbought, which raises the risk of a short-term pause or pullback.
- Volume is only 1.0× normal, so the breakout is supported, but not yet confirmed by a decisive participation surge.
Verdict invalidated if price falls below HKD 113.94, the SMA20, because that would weaken the current trend structure and suggest the breakout is losing traction.
- Ideal Entry Range: HKD 113.94 to HKD 125.80
- Exit Target: HKD 144.00
- Stop Loss protection: HKD 107.50
For non-traders: the chart still points upward, but the stock is already stretched enough that it may need to breathe before the next move.
Summary Data Alibaba
| Last price | 128.10 HKD |
| Change 1 day / 5 days / 1 month | 2.32% / 14.38% / 33.72% |
| Trend / MA-cross | uptrend / golden |
| SMA20 / SMA50 | 113.94 / 111.47 |
| RSI (14) / Stochastic %K | 67.4 / 83.8 |
| Bollinger %B / ATR | 125% / 5.46 |
| Support / Resistance 20 days | 107.50 / 125.80 |
| Data as of | 4 Agustus 2026 08:30 WIB |



