DIS Stock Gains 3.65%, Testing Key Resistance In Focus
On Agustus 6, 2026: price 101.76 USD, trend sideways, RSI 60.2, support 92.83, resistance 101.76. technical analysis of dis stock. DIS Stock Gains — full…

Disney’s shares closed at 101.76 on Aug. 5, 2026, up 3.65% from the previous close of 98.18, and the move matters because it pushed the stock to the very top of its recent trading range. As shown in the chart, Walt Disney (NYSE: DIS) is now trading above its 20-day average of 96.94 and also above its 50-day average of 98.90, a sign that buyers have regained control after a period of sideways action. But this is not a clean breakout yet: the stock is sitting at 100% of its 20-hour range, while momentum tools are sending a mixed message that often appears when a share is testing resistance rather than building a fresh trend.
Trend & Price Action
The broader pattern is still described as sideways, and that matters more than the day’s jump. A sideways trend means the stock has not yet established a durable higher-high, higher-low sequence; instead, it is oscillating inside a band, with brief bursts of strength that can fade if follow-through volume does not hold. The SMA20 is rising only modestly, with a slope of 0.19% over 5 days, which suggests the recent lift is real but not yet forceful. There is also no new MA-cross, so the chart has not delivered the cleaner signal that traders often look for when a short average decisively overtakes a longer one.
The Bollinger setup is the more interesting piece. The upper band sits at 100.67, and price is already above it, with %B at 115%. In plain English, that means DIS is trading beyond the usual statistical envelope of its recent range. That can signal strength, but it also often means the stock is stretched in the short term and vulnerable to a pause or pullback if buyers do not keep pressing. The band width is only 7.7%, described as a squeeze, which often precedes a larger move. Squeezes do not predict direction; they warn that the market is storing energy.
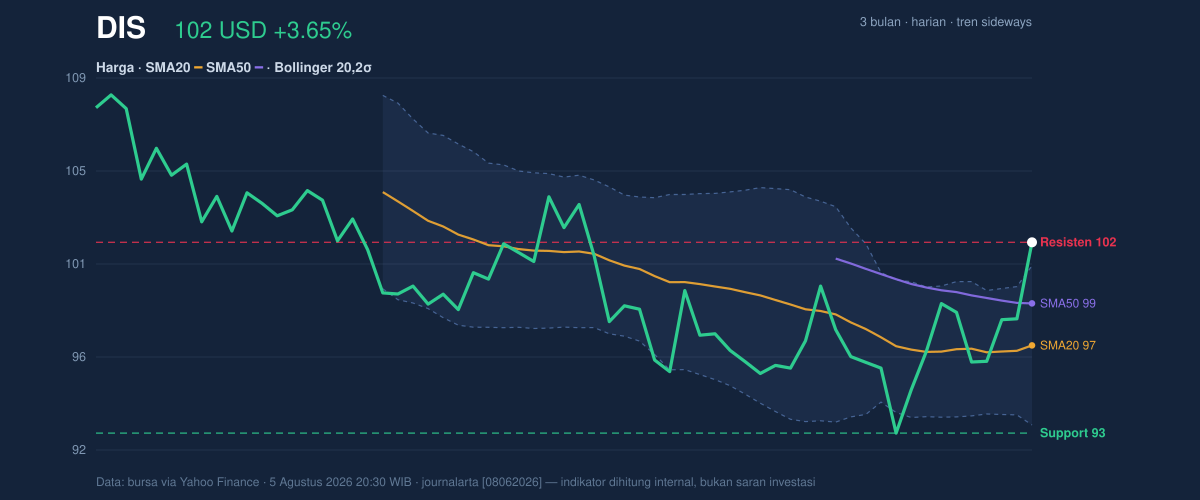
The price is also above the SMA50 at 98.90, which is constructive because it places the stock above both short- and medium-term trend markers. Still, the real test is whether DIS can do more than touch the upper edge of its range. The 3-month high is 110.48, while the 3-month low is 92.49, so the stock is trading in the upper half of that corridor but not near the prior peak. That leaves room for continuation if the current move broadens, but also room for consolidation if the market decides the move has run ahead of itself.
Oscillators & Momentum
The oscillators are split, which is exactly what traders should notice. The RSI at 60.2 is neutral, not overbought, and that is important because it says the stock still has room to advance before it reaches the kind of stretched condition that often triggers profit-taking. By contrast, the Stochastic %K at 86.5 and %D at 80.2 are both in overbought territory. Stochastic tends to react faster than RSI, so it is flagging that the latest push has been sharp enough to leave the stock near the top of its recent short-term range. That does not automatically mean reversal; it means the stock is no longer cheap on a very short horizon.
The MACD picture is more supportive. With MACD at -0.034, the line is still marginally below zero, but the signal line at -0.667 is lower still, leaving a positive histogram of 0.633. That combination means short-term momentum is improving relative to the slower trend, even if the indicator has not fully crossed into a strongly bullish regime. In other words, the market is leaning upward, but it has not yet built the kind of broad momentum that typically accompanies a decisive breakout.
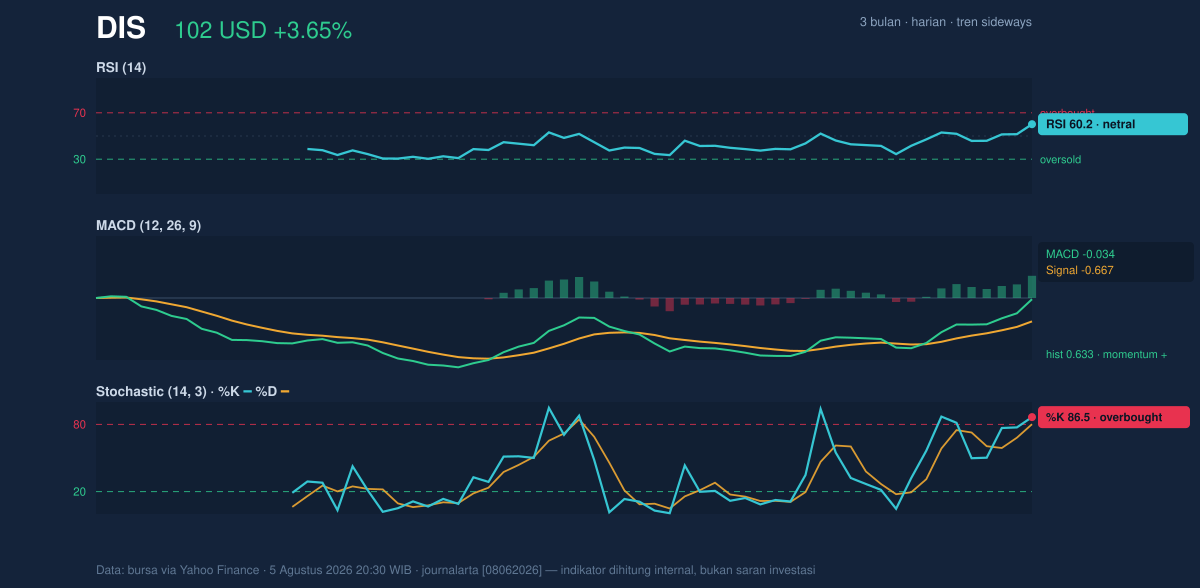
This is the kind of setup that can keep rising without looking “safe” on a momentum dashboard. The message is not that the stock is weak; it is that strength is becoming more visible just as the short-term oscillators begin to warn that the move is extended.
Volatility & Volume
Volume adds an important layer of confirmation. The latest print of 20,796,600 shares was about 1.8× the 20-day average of 11,807,640. That is not a casual uptick; it suggests the move was backed by real participation, not just thin trading. When price rises on heavier volume, the market is usually showing conviction. The OBV is rising as well, which means cumulative buying pressure has been improving over time rather than just for one session.
ATR at 2.51, or about 2.5% of price, points to moderate volatility. That is a useful detail because it implies the stock can still move meaningfully without entering a disorderly regime. Combined with the Bollinger squeeze, the setup suggests compression is giving way to expansion. The direction of that expansion is not guaranteed, but the market is clearly preparing for a larger swing than the recent day-to-day drift.
Key Levels & Scenarios
The immediate reference point is simple: 101.76 is both the latest price and the current 20-hour resistance. That means DIS is testing the ceiling rather than cruising comfortably above it. Below, the first structural support is the SMA20 at 96.94, which also matches the Bollinger middle band. That level matters because it is the market’s current balance point; losing it would suggest the breakout attempt has stalled. A deeper support area sits near the SMA50 at 98.90, which can act as a pivot if the stock pulls back but stays constructive. The broader floor is the 3-month low at 92.49, with the 20-hour support at 92.83 reinforcing that zone.
If DIS holds above 100.67 and continues to attract volume, the chart suggests room to probe the upper part of the recent range. If it slips back below 96.94, the message changes: the move would look more like a failed breakout than a trend change. The difference between those two outcomes is whether the market treats this surge as a launch or as a stretch.
Technical Verdict: HOLD (wait & see)
HOLD (wait & see)
- Reason 1: Price is above both the SMA20 and SMA50, which is constructive, but the chart is still labeled sideways and there is no new MA-cross.
- Reason 2: Volume at 1.8× average and a rising OBV confirm participation, while the MACD histogram at 0.633 shows improving momentum.
- Reason 3: The move is stretched at %B 115% and Stochastic overbought, so short-term upside may need a pause before it can extend cleanly.
- Verdict invalidated if price falls below 96.94, because that would put DIS back under the Bollinger middle band and the 20-day average.
- Ideal Entry Range: 96.94 to 98.90
- Exit Target: 100.67 to 101.76
- Stop Loss protection: below 92.83
For non-traders: the stock looks healthier than it did a few sessions ago, but it is still standing at a short-term ceiling, not yet in open air. “We’re seeing real strength, but the chart is asking for proof that this isn’t just a fast climb to resistance.”
Summary Data DIS
| Last price | 101.76 USD |
| Change 1 day / 5 days / 1 month | 3.65% / 3.33% / 5.23% |
| Trend / MA-cross | sideways / none |
| SMA20 / SMA50 | 96.94 / 98.90 |
| RSI (14) / Stochastic %K | 60.2 / 86.5 |
| Bollinger %B / ATR | 115% / 2.51 |
| Support / Resistance 20 days | 92.83 / 101.76 |
| Data as of | 5 Agustus 2026 20:30 WIB |


