HSBC Stock Drops 5.43%, Momentum Gains In Focus
On Agustus 6, 2026: price 1,510.60 GBp, trend sideways, RSI 69.4, support 1,454.00, resistance 1,597.40. technical analysis of hsbc stock.

At 1,510.60 GBp, HSBC Holdings is trading below its 20-day average and well off the day’s previous close of 1,597.40, with the latest move showing a sharp 5.43% one-day drop even as the stock remains 3.94% higher over the past month. That split matters: the longer move says buyers have been present recently, but the latest session says that demand is no longer carrying price cleanly through overhead supply. As shown in the chart, HSBC is now sitting in the middle of a broad trading band, where the next move is likely to be decided by whether the market respects support or keeps fading after the recent surge in volume.
Trend & Price Action
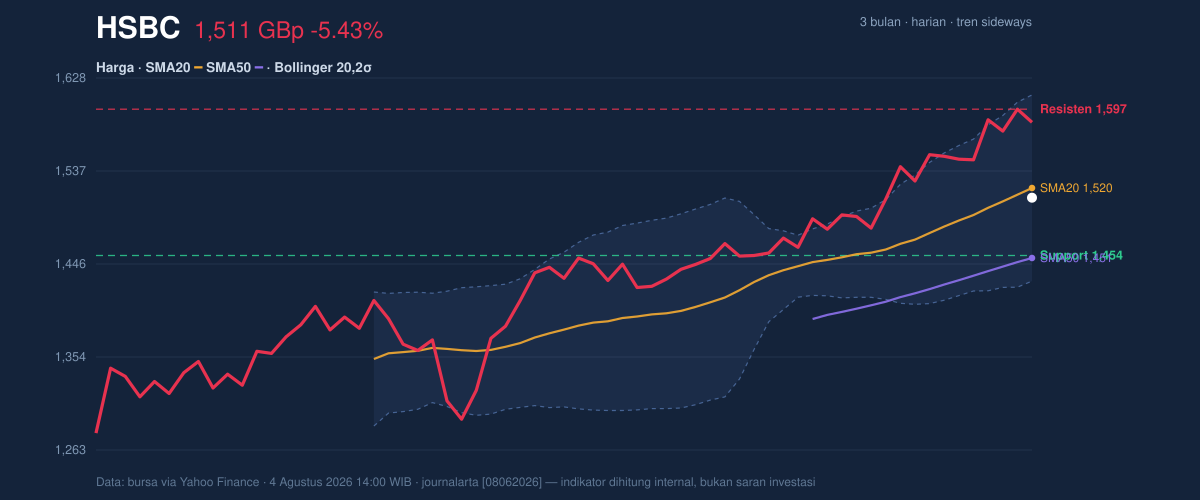
The broader setup is still described as sideways, and that is the key signal behind the tape. HSBC’s price is below SMA20 at 1,520.13 but above SMA50 at 1,451.48, which tells you the stock has not broken its medium-term uptrend, yet it has lost short-term momentum. In plain terms, the 20-day average is acting like a near-term balance line; trading below it suggests the latest buyers are no longer in control, while holding above the 50-day average keeps the larger structure intact.
The absence of a fresh MA-cross means the moving averages are not delivering a new trend signal yet. That usually points to consolidation rather than a decisive breakout or breakdown. The stock is also 39% through the 20-hour support-resistance range, which places it closer to support than to resistance, but not at a capitulation level. That positioning often leaves room for either a retest lower or a rebound if sellers exhaust themselves.
One important nuance: the 3-month range is wide, from 1,256.20 to 1,610.00, and HSBC is now closer to the upper half of that corridor than the lower end. That means the market has already recovered a meaningful amount from the deeper base, but it has not yet reclaimed the top of the range.
Oscillators & Momentum
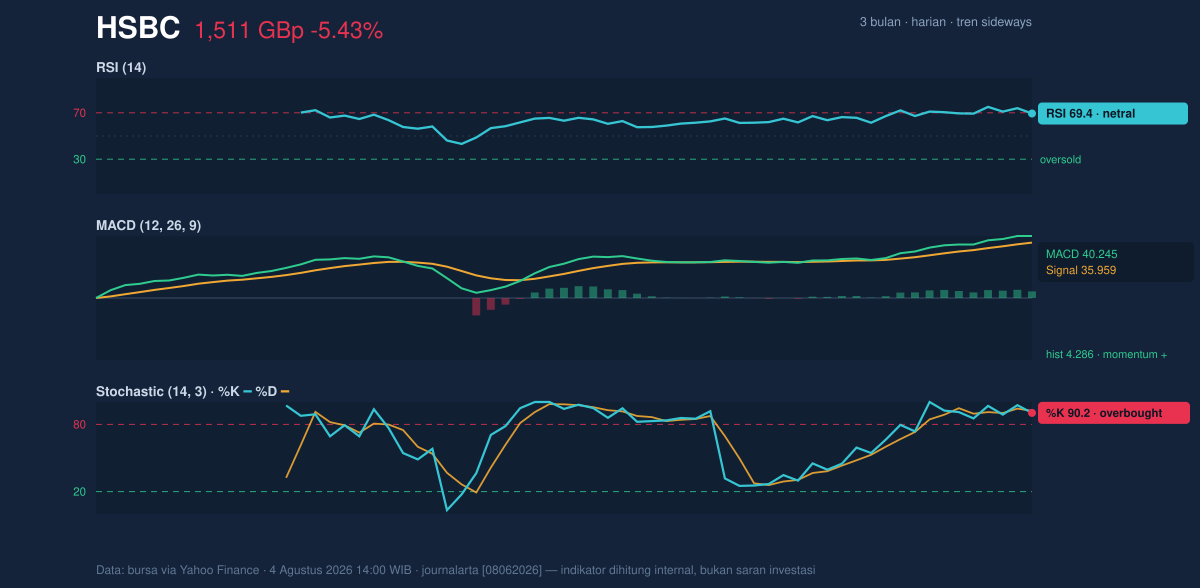
Momentum is mixed, which is usually where traders get trapped if they focus on only one indicator. The RSI at 69.4 is still technically neutral, but it is sitting close to the overbought threshold, meaning the stock has run hot enough that upside may need fresh confirmation rather than just continuation. The more forceful warning comes from Stochastic %K at 90.2 and %D at 92.1, both in overbought territory. That does not mean an immediate reversal is guaranteed, but it does mean the short-term move has become stretched relative to recent trading.
At the same time, the MACD remains positive, with the line at 40.245 above the signal line at 35.959 and a positive histogram of 4.286. That is the classic sign of underlying trend momentum still leaning upward, even if the pace has become uneven. In practical terms, MACD says the broader swing has not fully rolled over, while Stochastic says the stock may need to cool off before it can extend.
That combination is important: momentum is not bearish, but it is no longer cleanly supportive on the very short term.
Volatility & Volume
The Bollinger setup is also telling a balanced story. With the middle band at 1,520.13, HSBC is trading just below the center of the band, while the upper band sits at 1,611.45 and the lower band at 1,428.81. The %B reading of 45% suggests price is below the midline but not pressing the lower band, which is consistent with a market that is drifting rather than breaking. The 12.0% band width is normal, not squeezed, so there is no strong signal of an imminent volatility expansion from compression alone.
ATR adds another layer. At 39.99, or 2.6% of price, volatility is moderate. That means moves can still be meaningful, but the stock is not in a disorderly regime. The real question is whether the next range expansion happens upward through resistance or downward toward the lower band and support.
Volume, however, is the most cautionary piece in the set. Last volume came in at 41,510,155, nearly 1.9× the 20-day average of 21,812,033. Heavy volume on a down day often means the market is actively repricing the stock rather than simply drifting lower on thin participation. Yet OBV is falling, which signals that buying pressure has not been strong enough to offset distribution. In simple terms, more shares changed hands, but the balance of that activity still looks like net selling.
Key Levels & Scenarios
The first level to watch is support at 1,454.00, which lines up closely with the SMA50 at 1,451.48. That cluster is important because it combines a chart floor with a widely watched trend reference. If HSBC holds that zone, the market can argue that the recent drop is just a pullback inside a broader range. If it fails, the next leg lower would likely shift attention toward the lower Bollinger band at 1,428.81.
On the upside, resistance at 1,597.40 remains the first hurdle, and it sits just below the 3-month high of 1,610.00. That makes the area between roughly 1,597.40 and 1,610.00 a clear supply zone where prior sellers have already shown up. A move back through that region would be the first sign that the recent weakness has been absorbed.
The signal to read here is straightforward: if price reclaims the 20-day average and then pushes toward resistance with improving volume, the short-term damage starts to fade. If it cannot hold the support cluster, the market is likely saying the recent rally was running ahead of itself.
Technical Verdict: HOLD (wait & see)
HOLD (wait & see)
- RSI is near overbought at 69.4, while Stochastic is clearly overbought at 90.2 / 92.1, so the short-term move looks stretched.
- MACD is still positive, which keeps the broader momentum constructive, but price below SMA20 shows the near-term trend has weakened.
- Volume at 1.9× average on a down day, plus OBV falling, suggests distribution is present even though the stock remains above SMA50.
- Invalidation condition: this verdict is invalidated if price breaks below 1,454.00 and fails to recover the 1,451.48 SMA50 area.
- Ideal Entry Range: 1,454.00 to 1,520.13
- Exit Target: 1,597.40 to 1,611.45
- Stop Loss protection: below 1,428.81
For non-traders: HSBC is still holding its bigger trend, but the short-term chart says patience is more important than urgency right now.
The latest volume print was 41,510,155, versus a 20-day average of 21,812,033.
Summary Data HSBC
| Last price | 1,510.60 GBp |
| Change 1 day / 5 days / 1 month | -5.43% / -2.44% / 3.94% |
| Trend / MA-cross | sideways / none |
| SMA20 / SMA50 | 1,520.13 / 1,451.48 |
| RSI (14) / Stochastic %K | 69.4 / 90.2 |
| Bollinger %B / ATR | 45% / 39.99 |
| Support / Resistance 20 days | 1,454.00 / 1,597.40 |
| Data as of | 4 Agustus 2026 14:00 WIB |



