NVDA Stock Analysis: Gains 3.43%, Testing Key Resistance
On Agustus 6, 2026: price 219.22 USD, trend sideways, RSI 61.7, support 190.01, resistance 219.22. technical analysis of nvda stock. NVDA Stock Analysis — full…

Nvidia closed at 219.22 on Nasdaq, up 3.43% from the prior session, as the stock pushed to the top of its recent trading band in New York. The move matters because it leaves the shares pressing against the upper Bollinger Band, a sign that buyers have been willing to pay up even after a strong 15.37% gain over five days.
Trend & Price Action
The broader chart still reads as sideways, but the short-term tone has improved. Nvidia is trading above SMA20 at 205.36 and above SMA50 at 205.76, which tells investors the stock has reclaimed both short- and medium-term trend gauges. The two averages are sitting close together, and with no fresh MA-cross, the chart is not signaling a new long-term trend regime yet. Instead, it suggests a market that is stabilizing and then leaning higher inside a range.
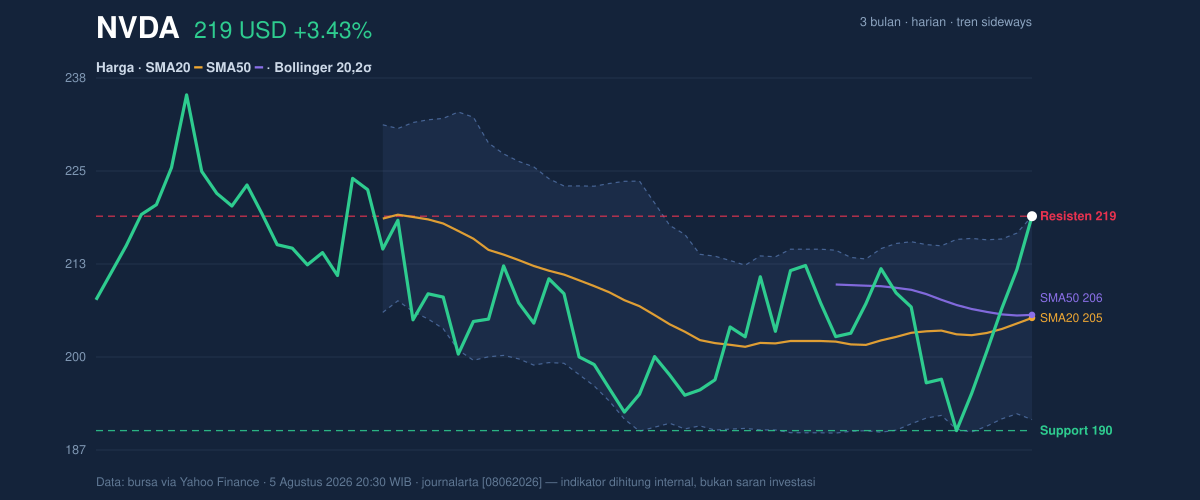
As shown in the chart, the key point is not just that price is above the moving averages; it is that it is now at the very top of the recent range. The 20-hour support at 190.01 and 20-hour resistance at 219.22 frame the current battle. With price at 100% of the range, Nvidia has already absorbed much of the available upside in the short window, so any further advance will need fresh demand rather than simple momentum carryover. The stock is also still below its 3-month high of 236.54, while remaining comfortably above the 3-month low of 189.80, which places it in the upper half of the recent quarterly structure without yet breaking into uncharted territory.
Oscillators & Momentum
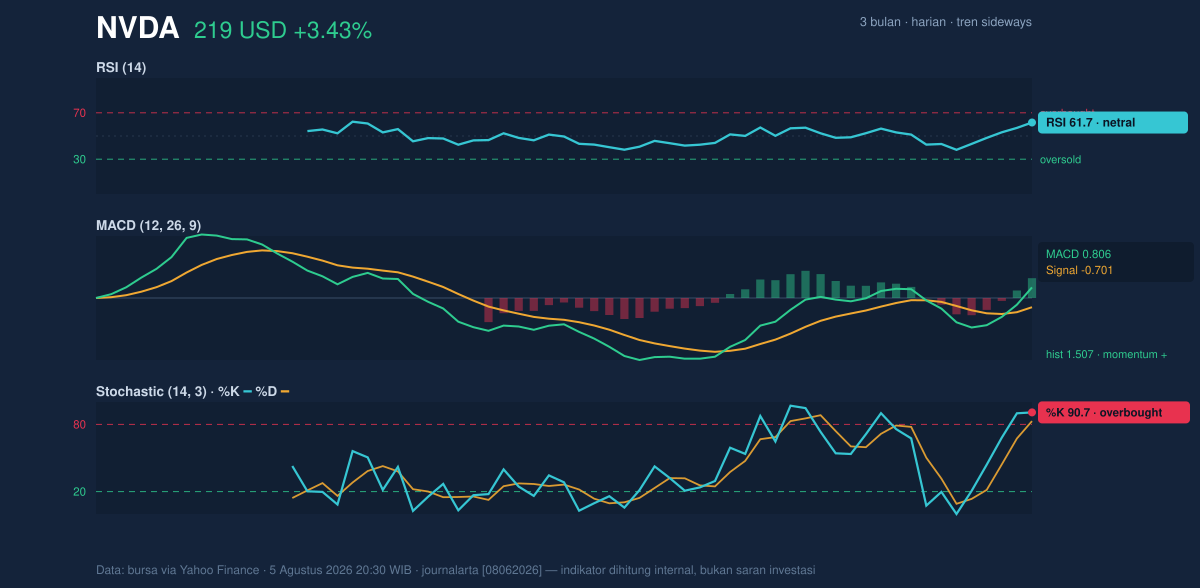
The momentum tools are mixed in a way that often appears near short-term peaks. RSI at 61.7 is still neutral, so the stock is not stretched enough to imply a serious trend break on its own. But the Stochastic %K at 90.7 and %D at 82.9 are both in overbought territory, which means the latest climb has been fast enough that the stock may be vulnerable to a pause or pullback if buyers hesitate. In plain terms, Stochastic is saying the stock has moved close to the top of its recent trading rhythm.
That overbought reading does not cancel the trend signal because the MACD at 0.806 remains above the signal line at -0.701, with a 1.507 histogram. MACD measures whether price momentum is expanding or fading; here it says the push higher still has positive force behind it. The key nuance is that momentum is positive, but it is also somewhat extended. That combination often produces continuation first and consolidation later, rather than a straight-line move.
Volatility & Volume
The volatility backdrop is important here. ATR(14) at 8.01, or 3.7% of price, indicates high volatility. For readers, ATR is a measure of the stock’s usual daily swing size. A reading this elevated means Nvidia can move quickly in either direction, so short-term levels matter more than they would in a calmer market. The Bollinger Bands reinforce that point: the upper band at 219.21 is essentially being touched by the last price, while the middle band at 205.36 sits well below. A price pinned to the upper band usually means strong momentum, but it can also mean the stock is temporarily overextended relative to its recent average.
The band width is 13.5%, described in the data as normal, which argues against a volatility squeeze. In other words, the chart is not coiling for a dramatic breakout from compressed conditions; it is already moving with enough room to fluctuate. Volume also supports the latest move: 157,555,300 shares traded versus a 20-hour average of 130,234,530, or about 1.2× normal. That matters because price gains on above-average participation are generally more credible than gains on thin trading. The OBV is rising, which means volume flow has been backing the advance rather than fading it.
Key Levels & Scenarios
The immediate technical map is straightforward. 219.22 is the first line of resistance because that is where the stock closed, and it also matches the upper Bollinger Band. If Nvidia can hold above that area, the chart would suggest a renewed attempt to extend the recent advance. If it slips back under the moving-average cluster around 205.36 to 205.76, the tone would shift from constructive to merely range-bound. A deeper loss of 190.01 would hand control back to sellers and expose the lower edge of the recent structure near the 3-month low of 189.80.
What the chart is really saying is that Nvidia has momentum, but it is now testing the limit of its short-term stretch.
Technical Verdict: HOLD (wait & see)
HOLD (wait & see)
- MACD is positive and the OBV is rising, which confirms that the latest advance has real participation behind it.
- Stochastic is overbought and price is sitting at the upper Bollinger Band, so the stock is extended in the near term.
- RSI at 61.7 is not extreme, but the broader chart is still labeled sideways, so this is not yet a clean trend breakout.
Verdict invalidated if price breaks below 190.01.
- Ideal Entry Range: 205.36 to 205.76
- Exit Target: 219.22
- Stop Loss protection: 190.01
For non-traders, that means the stock looks technically healthy, but it is also stretched enough that patience matters more than chasing strength.
Summary Data NVDA
| Last price | 219.22 USD |
| Change 1 day / 5 days / 1 month | 3.43% / 15.37% / 7.40% |
| Trend / MA-cross | sideways / none |
| SMA20 / SMA50 | 205.36 / 205.76 |
| RSI (14) / Stochastic %K | 61.7 / 90.7 |
| Bollinger %B / ATR | 100% / 8.01 |
| Support / Resistance 20 days | 190.01 / 219.22 |
| Data as of | 5 Agustus 2026 20:30 WIB |



