AIA Stock Technicals Today: Drops 6.28%, Golden Cross Formed
On Agustus 7, 2026: price 73.15 HKD, trend sideways, RSI 54.2, support 72.30, resistance 79.65. technical analysis of aia stock. AIA Stock Technicals — full…

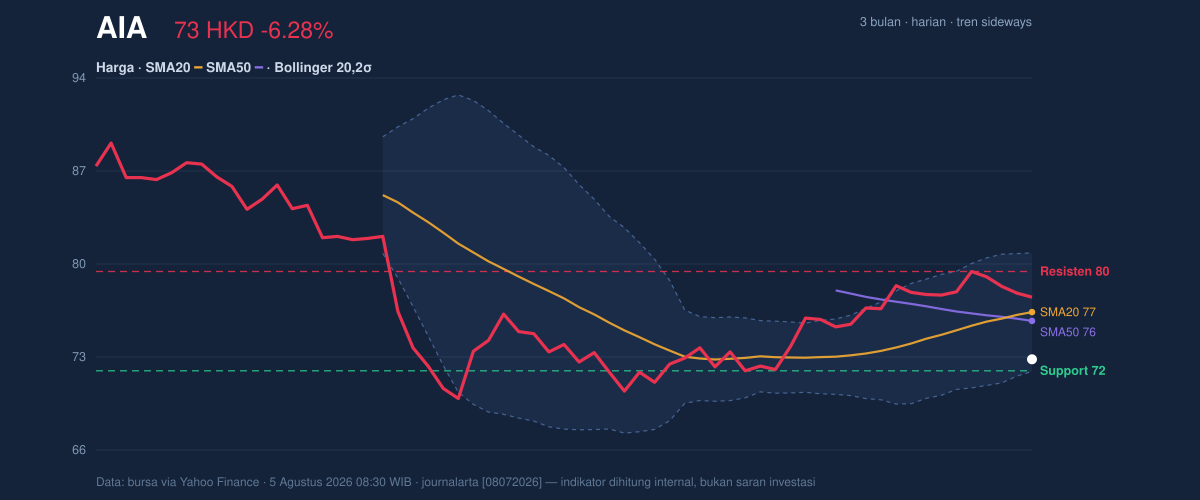
AIA Group fell to 73.15 HKD on HKEX, down 6.28% from the previous close of 78.05 HKD, even as the chart still shows a golden cross between the 20-day and 50-day moving averages. That contrast matters: the longer trend signal remains constructive, but the market is trading below the short-term average and close to the lower Bollinger band, a sign that sellers have the upper hand in the immediate session, as shown in the chart.
Trend & Price Action
The stock is still described as sideways, and that is the right label for a name that has not broken cleanly out of its recent range. The SMA20 at 76.64 HKD sits above the last price, while the SMA50 at 75.99 HKD remains just below it, so the market is caught between a medium-term recovery signal and a weaker day-to-day tape. A golden cross usually tells traders that the shorter average has improved enough to overtake the longer one, but the message is only meaningful if price stays above both lines. Right now, it does not.
The stock is also trading at the lower end of its recent band. With 20-hour support at 72.30 HKD and 20-hour resistance at 79.65 HKD, the last price is sitting in the lower part of the range, about 12% of the way up from support. That position suggests the market is testing whether the recent recovery structure can hold, rather than confirming a renewed uptrend. The 3-month low of 69.05 HKD still leaves room for a deeper pullback if near-term support gives way, while the 3-month high of 89.95 HKD remains well above current trading.
Oscillators & Momentum
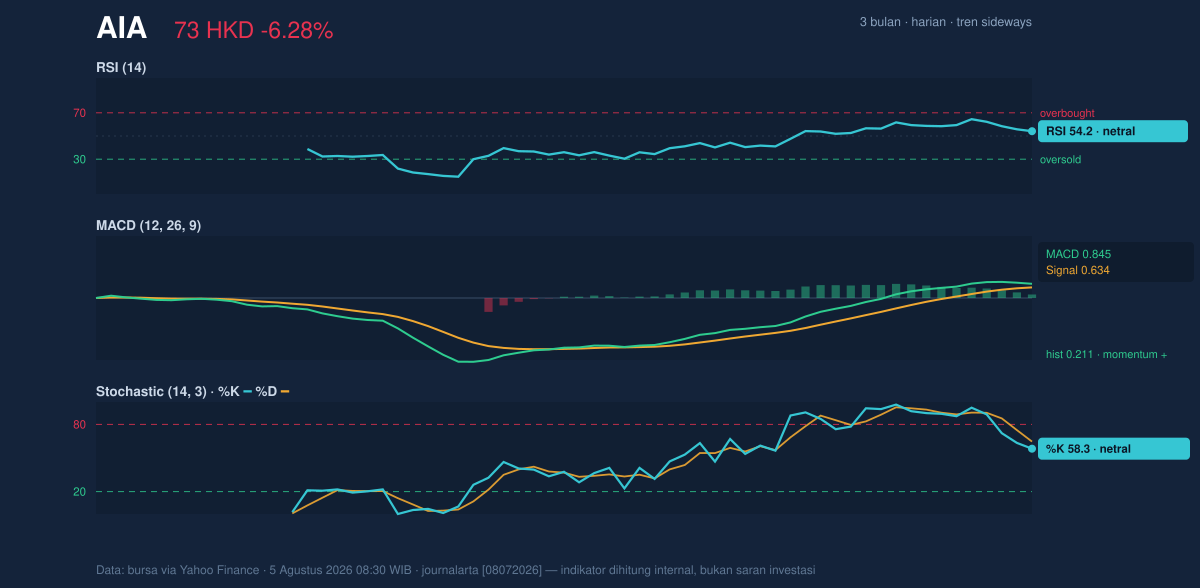
The momentum picture is more balanced than the price action. The RSI at 54.2 is neutral, which means the stock is neither stretched on the upside nor deeply oversold. In plain terms, that removes the case for a panic bounce, but it also avoids the warning sign of an overbought market. The Stochastic %K at 58.3 and %D at 64.6 are also neutral, though %K below %D hints that short-term momentum has cooled. That is not a full reversal signal, but it does show the recent slide has trimmed some of the earlier enthusiasm.
The stronger message comes from MACD. The MACD at 0.845, above its signal line at 0.634, leaves a positive histogram of 0.211. That is a classic sign that underlying momentum is still positive even if the price has weakened in the session. In other words, the trend engine has not fully stalled; it is just not being reflected in the latest trade. As shown in the chart, this is the kind of setup where price can look soft while momentum indicators remain mildly supportive.
Volatility & Volume
Bollinger Bands add an important layer. The band width is 11.4%, described as normal, so the stock is not in an unusually compressed or explosive volatility phase. That matters because a normal band width often means the next move depends more on order flow than on a technical squeeze. The %B at 10% is the sharper clue: price is hugging the lower edge of the band, which usually signals downside pressure or an oversold short-term position. It does not guarantee a rebound, but it does tell readers the stock is trading in a vulnerable zone.
Volume does not yet confirm a decisive trend change. Last volume was 18,363,926, below the 20-hour average of 21,697,226, or 0.8× normal. That means the drop came without full participation from the broader market, which often weakens the conviction behind a one-day selloff. At the same time, OBV is falling, and that is a more persistent warning: on-balance volume tracks whether money is quietly flowing in or out, and the current direction says distribution is still outweighing accumulation.
Key Levels & Scenarios
The line that matters most near term is 72.30 HKD support. If that level holds, the stock can attempt to stabilize back toward the middle Bollinger line at 76.64 HKD, then the 75.99 HKD moving average area, where buyers would need to prove they can reclaim control. If price fails to hold 72.30 HKD, the chart opens the door to a retest of the 69.05 HKD 3-month low. On the upside, a move back through 79.65 HKD resistance would ease the immediate pressure and suggest the recent drop was more of a shakeout than a trend break.
The key signal is not that AIA has turned weak in every time frame. It is that the stock is now testing whether a still-positive medium-term structure can survive a short-term break in price momentum, with the lower Bollinger band and falling OBV asking the same question from different angles.
Technical Verdict: HOLD (wait & see)
HOLD (wait & see)
- MACD remains positive with the histogram above zero, so the broader momentum backdrop has not fully rolled over.
- Price is below SMA20 and sitting near the lower Bollinger band, which argues for caution until the tape stabilizes.
- Volume is below average, so the selloff lacks strong participation, but OBV is falling, which keeps pressure on the setup.
Verdict invalidated if price breaks 72.30 HKD on a sustained basis.
- Ideal Entry Range: 72.30 HKD to 75.99 HKD
- Exit Target: 76.64 HKD to 79.65 HKD
- Stop Loss protection: below 72.30 HKD, with the next technical reference near 69.05 HKD
For non-traders: the chart says the long-term structure is not broken, but the short-term price is still under pressure and needs to prove it can hold support first.
Summary Data AIA
| Last price | 73.15 HKD |
| Change 1 day / 5 days / 1 month | -6.28% / -6.40% / -0.75% |
| Trend / MA-cross | sideways / golden |
| SMA20 / SMA50 | 76.64 / 75.99 |
| RSI (14) / Stochastic %K | 54.2 / 58.3 |
| Bollinger %B / ATR | 10% / 1.76 |
| Support / Resistance 20 days | 72.30 / 79.65 |
| Data as of | 5 Agustus 2026 08:30 WIB |


