DBS Stock Drops 0.10% Today, Momentum Weakens
On September 21, 2026: price 76.86 SGD, trend sideways, RSI 53.0, support 75.56, resistance 78.65. technical analysis of dbs stock. DBS Stock Drops — full…

DBS Group’s shares slipped 0.10% to SGD 76.86 as of 18 September 2026 08:00 WIB, leaving the stock just below its SMA20 at 77.07 while still above the SMA50 at 75.37. That positioning matters: it says the broader uptrend has not broken, but near-term momentum has cooled enough for the price to sit in a holding pattern rather than a decisive push higher. The stock is also trading in the upper half of its three-month range, with the 3-month high at 79.05 and the 3-month low at 65.03, but the latest signals point to a market that is waiting for direction rather than chasing one.
Trend & Price Action
As shown in the chart, DBS is in a sideways trend, and the slope of the SMA20 at 0.30% over 5 days suggests only a mild upward bias, not a strong trend. The fact that price is below the SMA20 but above the SMA50 is a classic “middle ground” setup: short-term traders are not fully in control, yet longer-term positioning has not turned defensive. There is also no new MA-cross, which means the moving averages are not giving a fresh trend signal. In plain terms, the chart is not showing a clean breakout or breakdown; it is showing a market that has absorbed recent gains and is now testing whether support can keep the structure intact.
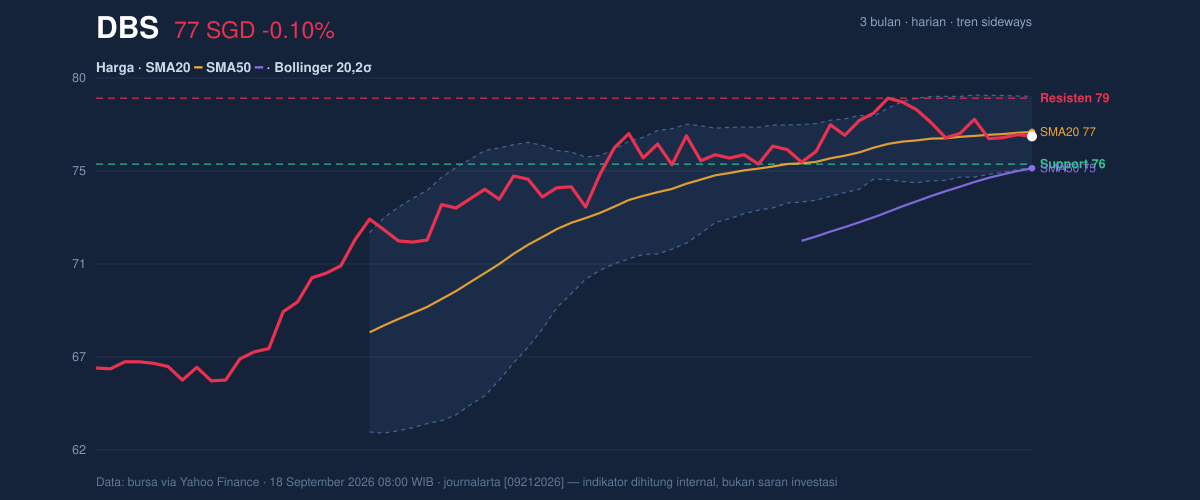
The price sits at 42% of the 20-hour range, with support at 75.56 and resistance at 78.65. That placement is important because it shows DBS is closer to support than to resistance, but not close enough to call it a bounce yet. The Bollinger Bands are narrowing, with the band width at 4.3%, which often signals compression before a larger move. Compression does not predict direction on its own; it simply tells traders that the market is storing energy.
A tight range can be calm before it is anything else.
Oscillators & Momentum
The momentum picture is mixed, and that is the main reason the stock does not yet look ready to leave its range. The RSI at 53.0 is neutral, meaning the stock is neither overbought nor oversold. That is consistent with a market lacking urgency. The Stochastic %K at 20.1 and %D at 28.6 also sit in neutral territory, but close enough to the lower end of the scale to suggest the stock has lost some short-term traction without tipping into a full selloff signal. More importantly, the MACD at 0.537 is still above zero, but the signal line at 0.792 is higher and the histogram at -0.256 is negative. That combination means the trend is not collapsing, but the pace of gains has weakened and bearish momentum is currently dominating the short-term rhythm.
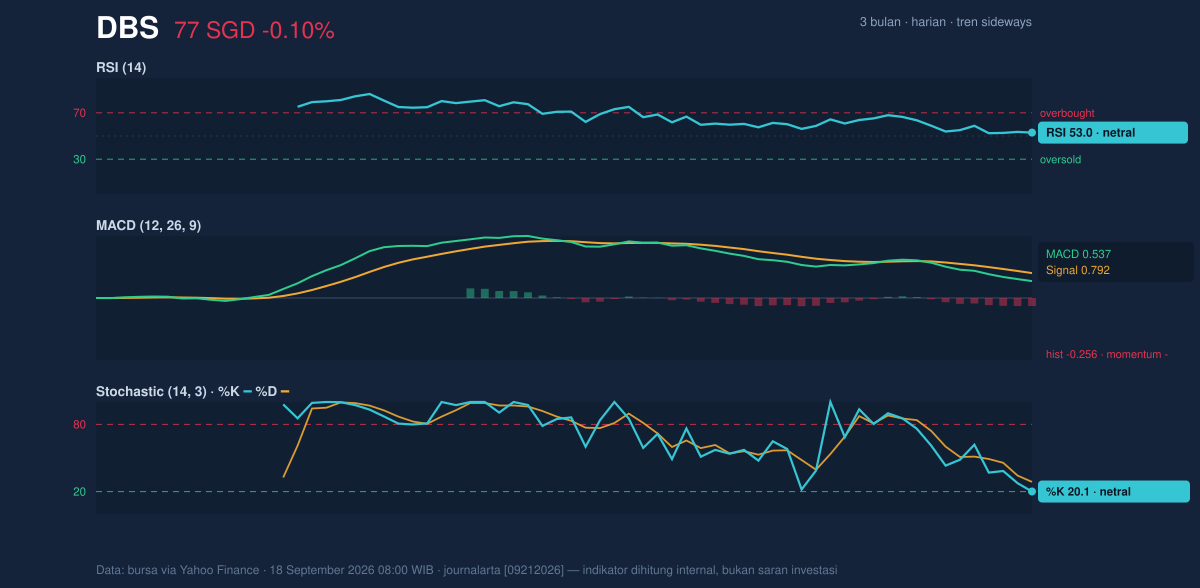
In practical terms, the oscillators are not confirming a breakout. They are telling us the market is in a pause phase, with momentum soft enough to cap enthusiasm but not weak enough to force a deeper reset. The signal is more caution than alarm.
Volatility & Volume
Volatility is subdued. The ATR(14) at 0.88, equal to 1.1% of price, indicates relatively low day-to-day movement. When ATR is that restrained and Bollinger Bands are squeezing, price can sit quietly for a while and then move quickly once it escapes the band structure. The key is that low volatility does not mean low risk; it often means risk is being delayed, not removed.
Volume adds a subtle but important layer. Last trading volume of 4,636,732 was about 1.3 times the 20-day average of 3,485,155, which shows participation increased even as price softened. That is not a bullish confirmation by itself, because OBV is falling, and falling On-Balance Volume means accumulated trading pressure has been leaning toward distribution rather than accumulation. In other words, more shares changed hands, but the balance of that activity has not been enough to push price above the short-term ceiling.
Volume is active. The trend is not.
Key Levels & Scenarios
The nearest technical map is straightforward. Support at 75.56 is the first line the market has to defend. If that level holds, DBS can continue to rotate inside the current range and potentially retest the upper band near 78.65. If price clears that resistance, the chart would begin to suggest that the Bollinger squeeze is resolving upward, with the upper band at 78.73 acting as a nearby technical reference. If 75.56 fails, the stock would likely be signaling that the current sideways structure is weakening, and the SMA50 at 75.37 becomes the next important marker because it separates a shallow pullback from something more consequential.
The stock is not far from either side of the range, which is why the next move matters more than the last one.
Technical Verdict: HOLD (wait & see)
HOLD (wait & see)
- RSI at 53.0 is neutral, so there is no strong momentum case either way.
- MACD histogram at -0.256 shows short-term momentum is negative even though price remains above the SMA50 at 75.37.
- Bollinger Bands are squeezing at 4.3%, which signals an imminent move but not the direction of that move.
- Verdict invalidated if price falls below 75.56, because that would break the nearest support and weaken the current range structure.
- Ideal Entry Range: 75.56 to 77.07
- Exit Target (Target Price): 78.65 to 78.73
- Stop Loss protection: below 75.37
For non-traders, this means DBS is still standing, but the chart is waiting for proof before it chooses a clearer direction.
“The market is compressed, the momentum is soft, and the next break will matter more than the last drift.”
Summary Data DBS
| Last price | 76.86 SGD |
| Change 1 day / 5 days / 1 month | -0.10% / -0.18% / 1.13% |
| Trend / MA-cross | sideways / none |
| SMA20 / SMA50 | 77.07 / 75.37 |
| RSI (14) / Stochastic %K | 53.0 / 20.1 |
| Bollinger %B / ATR | 44% / 0.88 |
| Support / Resistance 20 days | 75.56 / 78.65 |
| Data as of | 18 September 2026 08:00 WIB |


