Testing Key Resistance, UOB Stock Drops 0.24% Today
On September 21, 2026: price 41.78 SGD, trend sideways, RSI 51.9, support 40.64, resistance 42.33. technical analysis of uob stock. Testing Key Resistance —…

United Overseas Bank’s Singapore-listed shares edged down to SGD 41.78 on 18 September 2026, slipping 0.24% from the previous close even as the stock still sits above its short-term average and inside a tightening trading band. The move matters less for the size of the dip than for what it says about balance: UOB is no longer pressing higher with conviction, but neither is it breaking down, and the chart now shows a market waiting for the next catalyst rather than one that has already chosen a direction.
Trend & Price Action
The price is trading above the SMA20 at SGD 41.40 but below the SMA50 at SGD 42.23, which is the classic signature of a share in transition rather than a clear uptrend. In plain terms, the near-term bias is still supported, but the broader medium-term trend has not yet been reclaimed. The absence of a new MA-cross — meaning the faster moving average has not decisively crossed the slower one — reinforces that this is a sideways phase, not a fresh trend breakout.
That sideways label is important because the slope of the SMA20 is only 0.63% over 5 days, a mild upward tilt that suggests gradual accumulation rather than aggressive buying. The stock is also trading in the upper part of its recent range, at 67% of the 20-day range, with 20-day support at SGD 40.64 and 20-day resistance at SGD 42.33. As shown in the chart, the share price is hovering between those boundaries, close enough to resistance to attract profit-taking, but still comfortably above support.
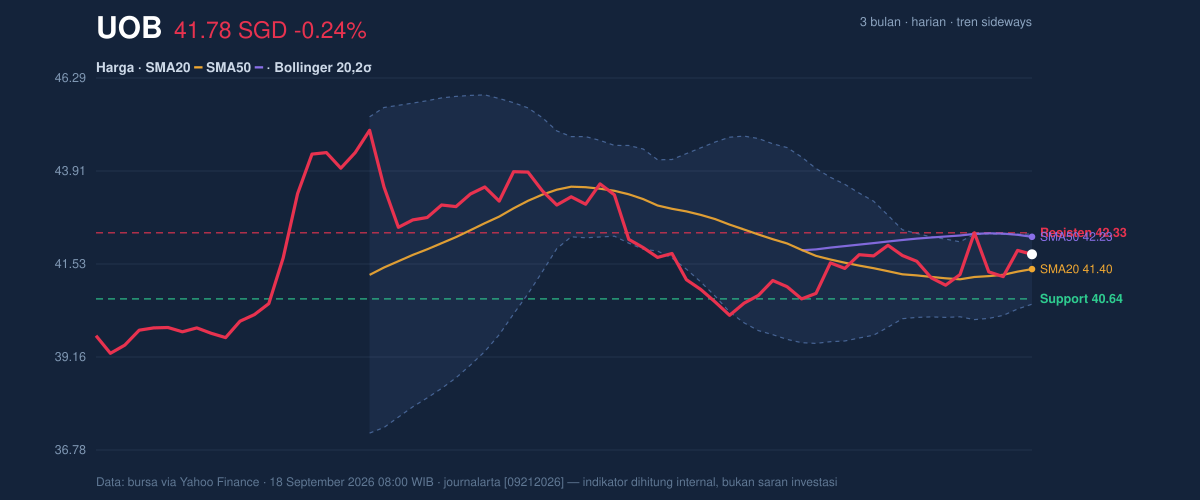
The broader frame is also useful. UOB’s 3-month range of SGD 39.08 to SGD 45.15 shows the stock is neither near panic lows nor back at the highs that would signal a full recovery. That middle-of-the-range position usually means the market is waiting for evidence: either a clean push through resistance, or a loss of support that confirms the current pause is turning into weakness.
Oscillators & Momentum
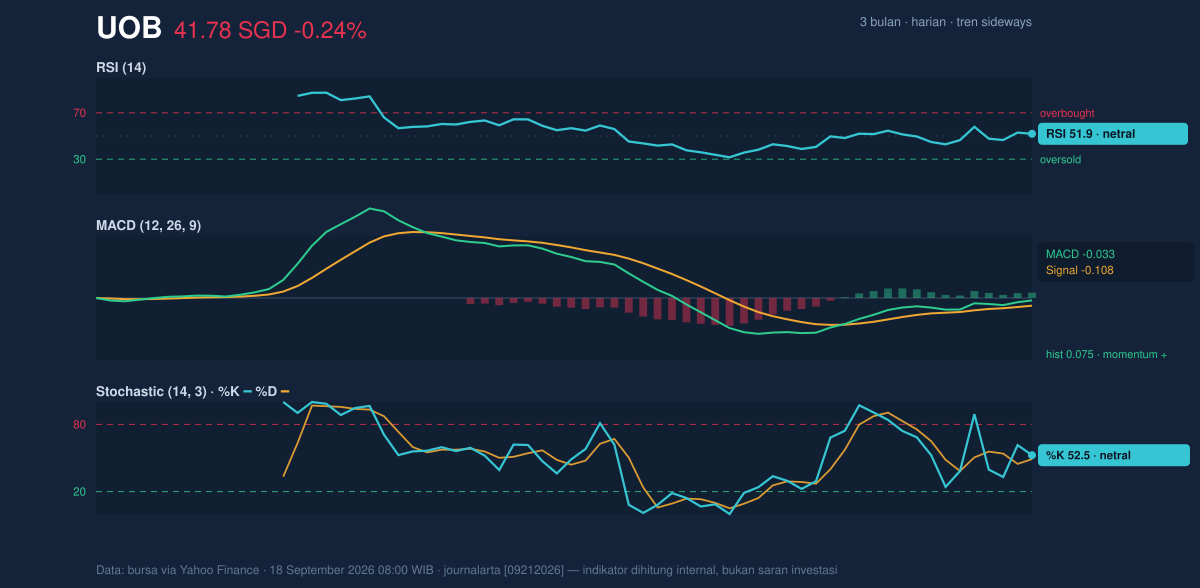
The momentum tools are not giving a dramatic signal, which is itself a signal. RSI at 51.9 is neutral, meaning the stock is not overbought and not oversold; it is simply balanced. That matters because a neutral RSI near the middle of the scale often accompanies consolidation, where price can move a little without building strong directional conviction.
The stochastic oscillator is similarly restrained, with %K at 52.5 and %D at 49.0. Since %K is only slightly above %D, the short-term momentum is leaning positive, but not strongly enough to imply a breakout on its own. In practical terms, this is a market that has some upward energy left, yet not enough to force a decisive move without help from volume or a broader market trigger.
The more constructive clue comes from MACD. MACD at -0.033 is still slightly below zero, but the histogram at 0.075 shows momentum has turned positive relative to its signal line. That combination often means the stock is improving beneath the surface even if price has not fully confirmed it. The chart therefore points to a cautious improvement in momentum, not a full trend reversal.
Volatility & Volume
The Bollinger Bands are telling a useful story. With the upper band at SGD 42.30, the middle band at SGD 41.40, and the lower band at SGD 40.50, price is sitting above the center line and closer to the top of the envelope. The key detail is that the 4.3% band width is narrowing, which is a squeeze. A squeeze usually means volatility has compressed and the stock is storing energy; when that happens, the next move can be sharper than the recent day-to-day drift.
That does not guarantee direction. It simply means the market is building pressure. A move above the upper band would suggest buyers are finally forcing a range expansion, while a slip back toward the lower band would imply the squeeze is resolving to the downside instead. For now, the price is in the constructive half of that band, which keeps the near-term tone mildly positive.
Volume adds a more cautious note. Last traded volume of 3,562,952 was about 1.3× the 20-day average of 2,802,193, so participation was above normal. Yet OBV is falling, and that divergence matters: on-balance volume tracks whether trading pressure is accumulating or leaking away. When price is holding up but OBV is slipping, it often means rallies are not being backed by sustained net buying. In other words, the market is active, but not fully convinced.
Key Levels & Scenarios
The short-term map is clear. SGD 42.33 is the immediate resistance to watch, aligned closely with the Bollinger upper band at SGD 42.30. A clean move through that area would matter because it would show price escaping the current squeeze and challenging the upper end of the recent range. On the downside, SGD 40.64 is the first support, and the Bollinger lower band at SGD 40.50 sits just below it, making that zone the first real test of whether the sideways structure can hold.
If price fails to hold SGD 40.64, the chart would shift from consolidation to a more defensive setup, with the next reference point coming from the lower Bollinger band and the broader 3-month floor at SGD 39.08. If price clears SGD 42.33 decisively, the market would be signaling that the squeeze is resolving upward and that the stock may be ready to retest the higher part of its 3-month range.
Technical Verdict: HOLD (wait & see)
HOLD (wait & see) fits the chart best because the stock is above SMA20 and the MACD histogram is positive, but it is still below SMA50 and OBV is falling, which tempers the case for a clean upside break. The Bollinger squeeze suggests a larger move may be coming, yet RSI and Stochastic remain neutral rather than confirming a strong directional push.
- Ideal Entry Range: SGD 40.64 to SGD 41.40
- Exit Target: SGD 42.30 to SGD 42.33
- Stop Loss protection: below SGD 40.50
Verdict invalidated if price breaks below SGD 40.50.
In plain English, UOB’s chart is not weak, but it is not yet strong enough to call a decisive breakout.
Summary Data UOB
| Last price | 41.78 SGD |
| Change 1 day / 5 days / 1 month | -0.24% / 1.26% / 3.08% |
| Trend / MA-cross | sideways / none |
| SMA20 / SMA50 | 41.40 / 42.23 |
| RSI (14) / Stochastic %K | 51.9 / 52.5 |
| Bollinger %B / ATR | 71% / 0.63 |
| Support / Resistance 20 days | 40.64 / 42.33 |
| Data as of | 18 September 2026 08:00 WIB |


