Singtel Stock Analysis: Drops 1.58%, Testing Support Level
On September 21, 2026: price 4.35 SGD, trend sideways, RSI 37.8, support 4.35, resistance 4.56. technical analysis of singtel stock. Singtel Stock Analysis —…

Singapore Telecom (Singtel) fell to SGD 4.35 on SGX on 18 September 2026, down from a previous close of 4.42, as the stock slipped back to the lower edge of its recent range even while trading volume surged to more than double its 20-day average. The move matters because it shows sellers are still pressing the shares despite a burst of participation, and that combination often signals distribution rather than quiet consolidation.
Trend & Price Action
The broader pattern remains sideways, but it is a weak sideways trend: the 20-day moving average is edging lower at -0.09% over five days, and the share price is sitting below SMA20 at 4.48 while still above SMA50 at 4.44. That positioning tells a simple story. The medium-term trend has not broken down decisively, but the shorter-term tape has lost momentum, leaving the stock stuck between a fading near-term average and a still-supportive longer one.
The chart also shows no fresh moving-average cross, which means there is no new trend signal yet, only pressure building under the surface. With the price at the bottom of the 20-hour range and the 3-month range still defined by 4.70 on the high side and 4.19 on the low side, Singtel is trading closer to the lower half of its recent corridor than the upper half. That is not a collapse, but it does mean the market is probing support rather than rewarding momentum.
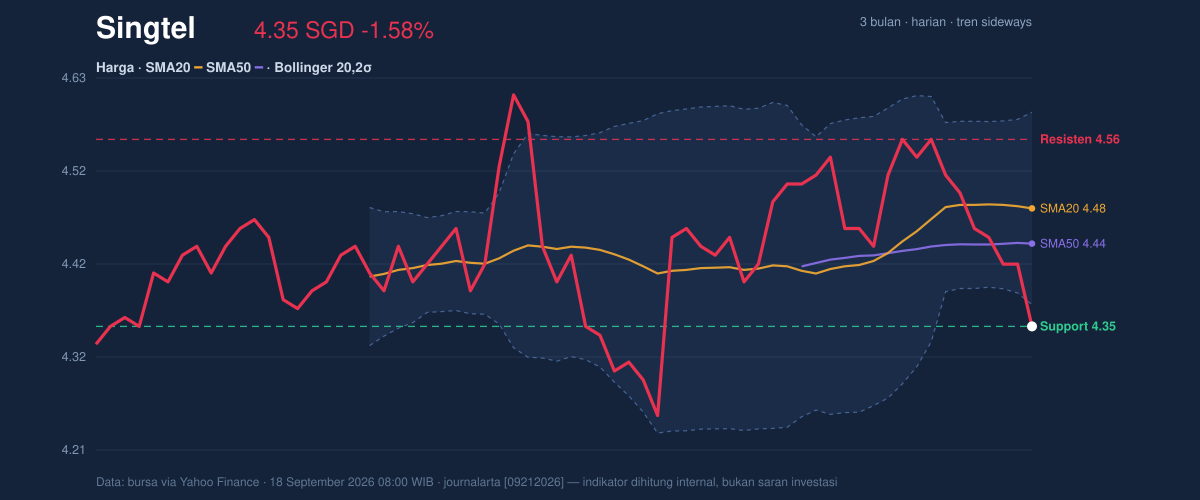
The most important level on the chart is support at 4.35, which is exactly where the stock closed. That makes the session less a clean breakdown than a test of whether buyers are willing to defend the floor. Above that, resistance sits at 4.56, and the gap between the two levels frames the immediate battleground.
Oscillators & Momentum
Momentum signals are mixed, and that mix is telling. RSI at 37.8 is still technically neutral, but it is leaning weak, which means the stock has room to fall before becoming deeply oversold. By contrast, the Stochastic reading is much more stretched: %K at 14.3 and %D at 14.8 both sit in oversold territory, a sign that short-term selling may be getting tired.
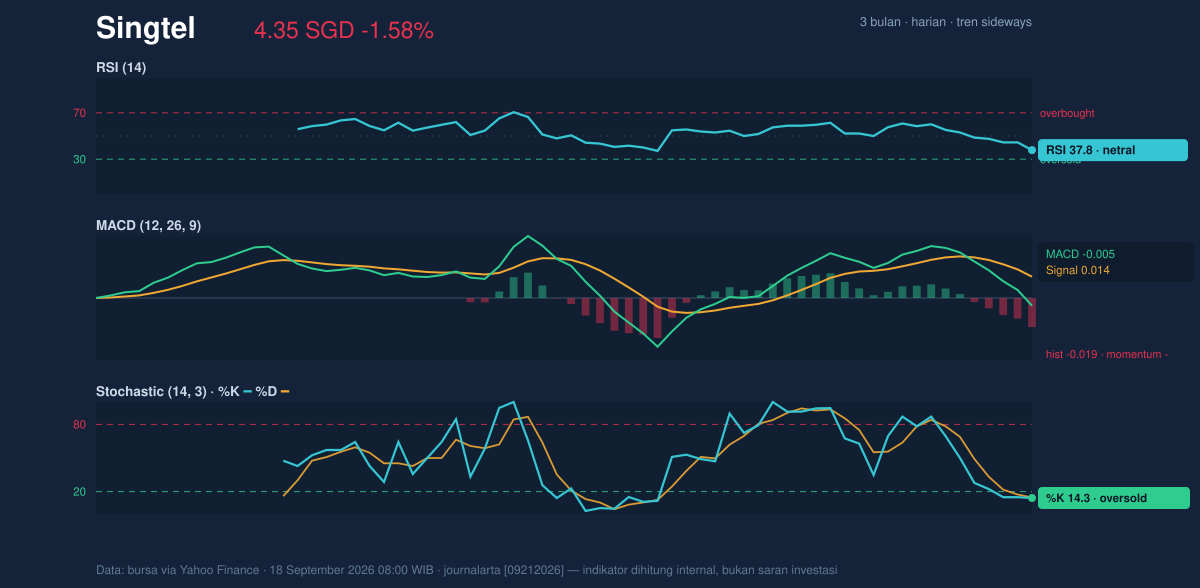
The catch is the MACD, which remains negative at -0.005 versus a signal line of 0.014, with a histogram at -0.019. In plain English, MACD is still confirming downside momentum, not reversal. So while Stochastic suggests the stock is near a short-term exhaustion point, MACD says the broader impulse has not yet turned. That divergence often appears near turning points, but it can also persist if selling pressure keeps reasserting itself.
Volatility & Volume
Bollinger Bands are tightening, with the band width at 4.8%, which points to a squeeze. A squeeze usually means the market is coiling for a larger move, not drifting forever. Here, that setup is made more interesting by the fact that the price is sitting below the middle band at 4.48 and even below the lower band at 4.37, with %B at -11%. That reading means the stock is trading beneath the normal band envelope, a sign of pressure that can sometimes precede a snapback, but only if buyers step in quickly.
Volume adds another layer. The latest turnover of 44,301,194 was about 2.2× the 20-day average of 20,585,668, which confirms that the move was not caused by thin trading. Yet OBV is falling, and that is the more important clue: on-balance volume tracks whether volume is accumulating on up days or draining on down days. A falling OBV means the recent volume has been associated more with distribution than accumulation, so the surge in activity is not automatically constructive.
ATR at 0.08, or 1.8% of price, suggests volatility is moderate rather than explosive. That matters because the squeeze in Bollinger Bands may still be building, but the stock has not yet shifted into a high-volatility regime. The result is a market that looks compressed, fragile, and capable of moving sharply once one side gives way.
Key Levels & Scenarios
The immediate downside test is clear: if 4.35 fails, the next reference is the lower Bollinger band at 4.37, which is already above the close and therefore offers little cushion. Below that, the 3-month low at 4.19 becomes the next major marker.
On the upside, the first hurdle is 4.48, the 20-day average and Bollinger middle band, because reclaiming it would show the stock can recover the short-term trend. After that, 4.56 is the near resistance level, and only a move through that area would suggest the squeeze is resolving to the upside rather than the downside.
The key signal here is not just where the price is, but what it is doing relative to the bands and averages. Trading below the middle band while OBV falls and MACD stays negative is usually a warning that rallies may be sold until proven otherwise. At the same time, oversold Stochastic readings mean a reflex bounce is possible, but not yet confirmed.
Technical Verdict: HOLD (wait & see)
HOLD (wait & see)
- MACD is negative and the histogram remains below zero, so downside momentum is still active.
- Price is below SMA20 at 4.48 and under the Bollinger middle band, which keeps the short-term trend soft.
- Stochastic is oversold, but OBV is falling, so short-term exhaustion is not yet backed by accumulation.
Verdict invalidated if price falls below 4.19, the 3-month low and the clearest downside reference in the data.
- Ideal entry range: 4.35 to 4.37
- Exit target: 4.48 to 4.56
- Stop loss protection: below 4.19
In plain English, the chart says Singtel is close to a short-term turning point, but the market has not yet shown enough strength to confirm it.
Summary Data Singtel
| Last price | 4.35 SGD |
| Change 1 day / 5 days / 1 month | -1.58% / -3.33% / -1.14% |
| Trend / MA-cross | sideways / none |
| SMA20 / SMA50 | 4.48 / 4.44 |
| RSI (14) / Stochastic %K | 37.8 / 14.3 |
| Bollinger %B / ATR | -11% / 0.08 |
| Support / Resistance 20 days | 4.35 / 4.56 |
| Data as of | 18 September 2026 08:00 WIB |


