OCBC Stock Gains 0.32% Today, Momentum Weakens
On September 21, 2026: price 31.38 SGD, trend sideways, RSI 54.3, support 30.90, resistance 32.27. technical analysis of ocbc stock. OCBC Stock Gains — full…

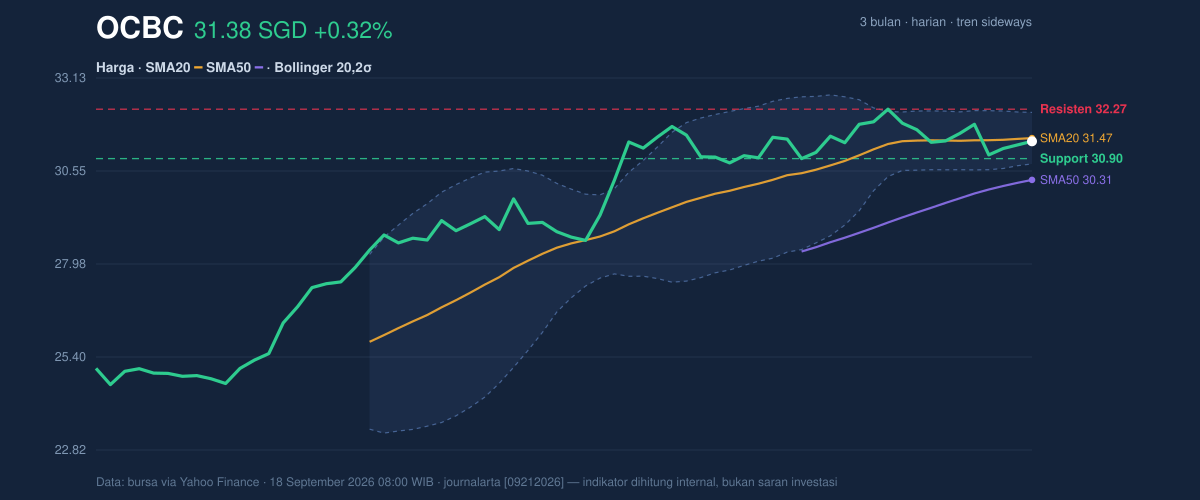
OCBC Bank’s shares on SGX edged up to 31.38 SGD from 31.28, but the tape still reads as a stock searching for direction rather than breaking into a fresh trend. The latest move sits inside a broader sideways pattern, with the price trading below the 20-day simple moving average at 31.47 even as it remains well above the 50-day line at 30.31. That combination matters: it suggests the medium-term floor has improved, but short-term momentum has not yet fully reclaimed control.
Trend & Price Action
As shown in the chart, OCBC is positioned in the upper half of its recent range but not near the top of it, with the price at 35% of the 20-hour range and the nearest support at 30.90 versus resistance at 32.27. In plain terms, the stock is not under pressure to retest the lows, yet it has also not proved it can push through the ceiling that has capped recent advances. The 50-day average at 30.31 still acts as a deeper reference point, and the fact that price is above it tells investors the longer trend has not broken down. But the absence of a fresh moving-average crossover means the chart is still waiting for confirmation, not declaring a new phase.
The 20-day average is sloping up by 0.24% over five days, which is a modest positive signal. It says buyers have been willing to lift the average price slightly, but not decisively enough to force a trend change. That is consistent with the stock’s 1.29% gain over one month and 0.32% rise over one day, versus a 0.70% decline over five days. The message is mixed: short bursts of demand are appearing, yet they have not produced sustained follow-through.
Oscillators & Momentum
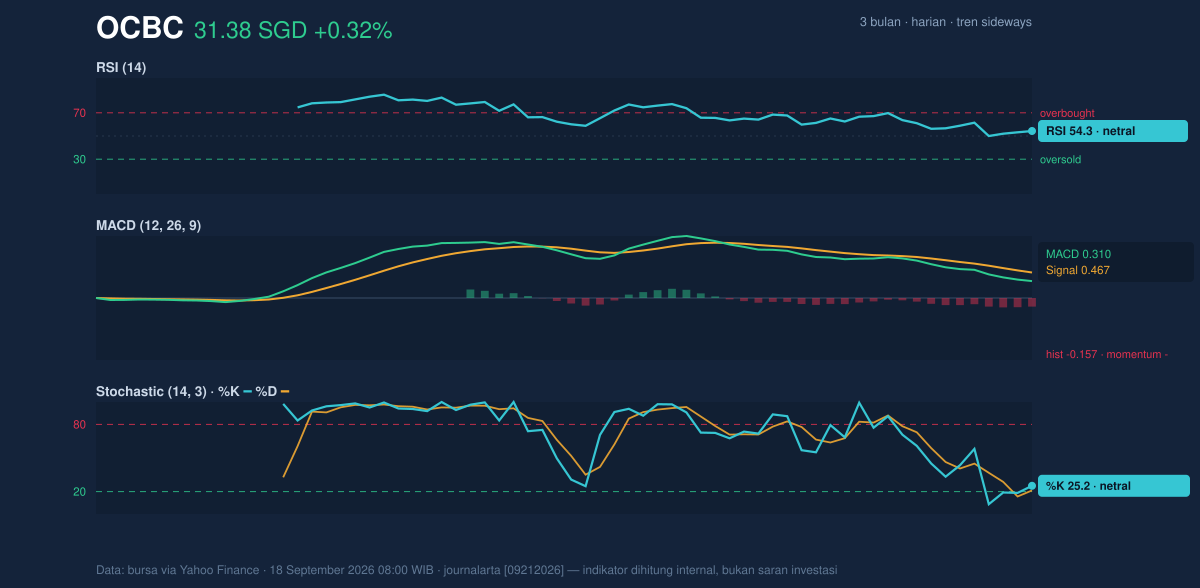
The momentum picture is more nuanced than the price action alone. The RSI at 54.3 is neutral, which means the stock is neither overbought nor oversold. That is important because it leaves room for movement in either direction, rather than signaling exhaustion or panic. The Stochastic oscillator at %K 25.2 and %D 21.1 is also neutral, but it sits close to the lower end of its band, hinting that near-term selling pressure has eased. In practical terms, this is a market that has cooled enough to recover, but not enough to guarantee it will.
The more cautionary signal comes from MACD at 0.310 below the signal line at 0.467, with a negative histogram of -0.157. That configuration means the short-term trend is still lagging the longer trend, even if the broader structure has not deteriorated. For readers unfamiliar with the term, MACD is a trend-following gauge: when it sits below its signal line, upside momentum is weaker than it looks on the surface. So while price is stable, the internal push behind it remains soft.
Volatility & Volume
Bollinger Bands add another layer to the story. The band width is 4.5%, and that is described here as a squeeze, meaning volatility has narrowed and the stock may be preparing for a larger move. The price sits at %B 44%, which places it below the middle band at 31.47 but comfortably above the lower band at 30.75. That positioning matters because it shows OCBC is not stretched; it is trading in the lower-middle part of its volatility envelope, where a push toward the upper band at 32.18 would require fresh demand.
Volume is the clearest sign that something may be changing. The latest turnover of 14,543,263 shares was about 2.5 times the 20-session average of 5,725,523, and OBV is rising. OBV, or on-balance volume, tracks whether volume is flowing into the stock on up days or out of it on down days. A rising OBV alongside a volume spike usually suggests participation is improving, even if price has not yet broken out. In other words, the market is showing interest before it is showing conviction.
Key Levels & Scenarios
The immediate technical map is fairly clear. 30.90 is the first support to watch, and 30.75 is reinforced by the lower Bollinger Band. Below that, the 50-day average at 30.31 becomes the more important structural line. On the upside, 31.47 is the first hurdle because it is the 20-day average and the Bollinger midline, while 32.18 and 32.27 form the next resistance cluster. The stock’s 3-month high of 32.57 is the broader ceiling that would matter if momentum improves.
If OCBC clears 31.47 with follow-through, the chart would start to look less neutral and more constructive, because price would be reclaiming the short-term trend reference. If it instead slips below 30.90, the squeeze could resolve downward and expose 30.75 and then 30.31. The current setup is therefore less about direction already decided and more about which boundary gives way first.
Technical Verdict: HOLD (wait & see)
HOLD (wait & see) is the most defensible reading because the chart is balanced between a supportive longer trend and a weaker short-term momentum profile.
- Reason 1: Price is below the 20-day SMA at 31.47, so short-term trend control has not been reclaimed.
- Reason 2: MACD remains negative versus its signal line, showing momentum is not yet aligned with a stronger advance.
- Reason 3: Volume surged to 2.5× average and OBV is rising, which argues that participation is improving and a breakout is possible if resistance gives way.
- Verdict invalidated if price falls below 30.90, because that would weaken nearby support and raise the odds of a deeper test toward 30.75 and 30.31.
- Ideal entry range: 30.90 to 31.47
- Exit target: 32.18 to 32.27, with 32.57 as the broader chart ceiling
- Stop loss protection: below 30.75, with the deeper line at 30.31
In plain English, OCBC is at a point where the next move matters more than the last one, and the chart is waiting for either a clean reclaim of 31.47 or a drop through 30.90.
Summary Data OCBC
| Last price | 31.38 SGD |
| Change 1 day / 5 days / 1 month | 0.32% / -0.70% / 1.29% |
| Trend / MA-cross | sideways / none |
| SMA20 / SMA50 | 31.47 / 30.31 |
| RSI (14) / Stochastic %K | 54.3 / 25.2 |
| Bollinger %B / ATR | 44% / 0.51 |
| Support / Resistance 20 days | 30.90 / 32.27 |
| Data as of | 18 September 2026 08:00 WIB |


