LLY Stock Technicals Today: Gains 1.89%, Momentum Weakens
On Agustus 7, 2026: price 1,191.94 USD, trend sideways, RSI 55.0, support 1,115.68, resistance 1,220.66. technical analysis of lly stock.

Eli Lilly edged up to 1,191.94 dollars on the NYSE, rising 1.89% in the latest session as the shares moved closer to the upper half of their recent trading band, according to exchange-linked market data cited via Yahoo Finance. The move matters less as a one-day headline than as a signal that buyers are still willing to step in above the short-term average, even though the broader pattern remains stuck in a sideways range. In plain terms, the stock is not breaking away decisively, but it is also not behaving like a name under sustained distribution.
Trend & Price Action
The chart shows a stock that is trying to hold an improving position without yet proving a full trend change. LLY is trading above its SMA20 at 1,171.30 and above its SMA50 at 1,155.49, which tells traders that the short- and medium-term baselines are still underneath the market. That is constructive. But the slope of the SMA20 at -1.41% over 5 days says the short-term trend is still leaning down, which is why the broader label remains sideways rather than bullish.
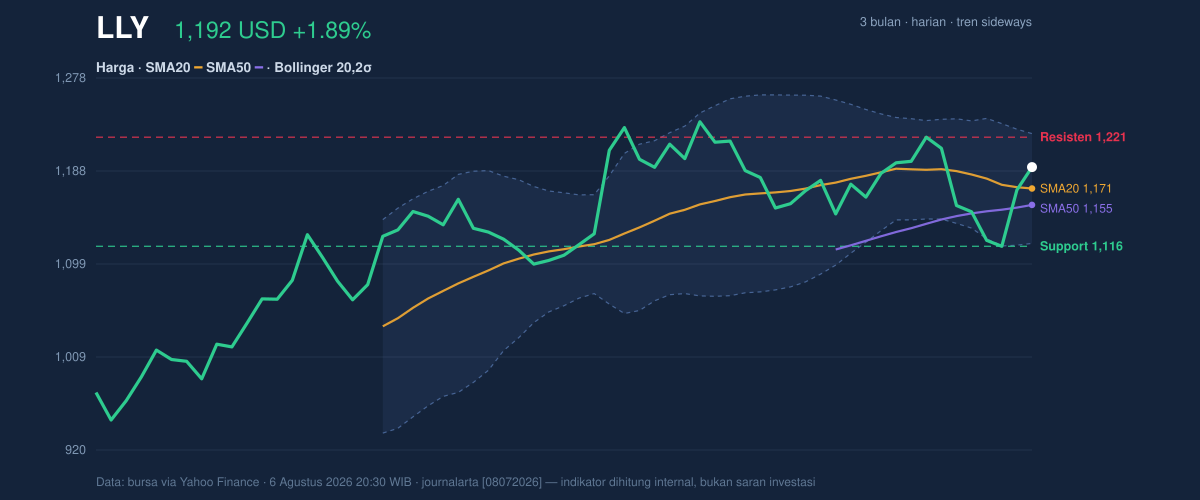
The price is also sitting at 73% of its 20-hour range, with support at 1,115.68 and resistance at 1,220.66. That positioning suggests the market has recovered enough to test the upper part of the range, but not enough to claim control of it. The 3-month high at 1,249.45 and low at 943.26 frame the bigger picture: the stock has already rebounded sharply from the lower end of that span, yet it remains below the ceiling that would make the move look more convincing. The lack of a fresh MA-cross also matters. When moving averages do not cross, it usually means the market is still sorting out direction rather than committing to a new phase.
Oscillators & Momentum
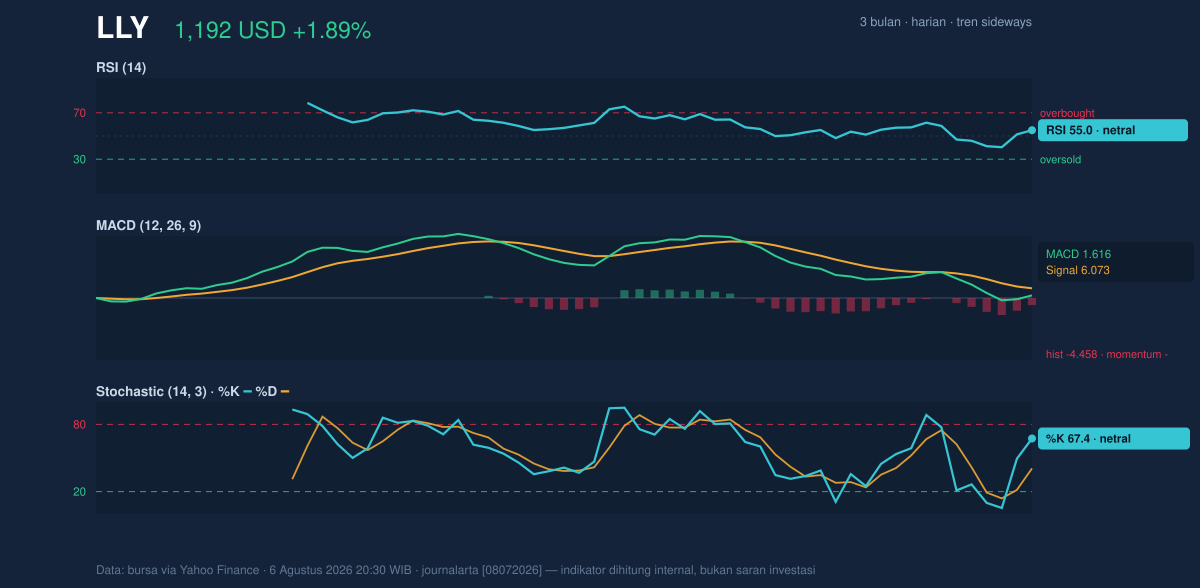
Momentum is mixed, and that is the most important signal in this name right now. RSI at 55.0 is neutral, which means the stock is neither stretched nor washed out. Stochastic %K at 67.4 and %D at 40.7 also sit in neutral territory, but the gap between the two lines suggests the short-term rebound still has some life if buyers keep pressing. The problem is the MACD histogram at -4.458, which shows momentum is still negative even though price is above the moving averages. That combination often signals a market in transition: price has improved faster than the underlying trend-following indicator has turned.
For non-specialists, the message is straightforward. RSI and Stochastic are not flashing danger, but MACD says the move has not yet earned full confirmation. In other words, the stock is recovering, not sprinting.
Volatility & Volume
Volatility is elevated enough to matter. The ATR(14) at 41.94, or 3.5% of price, means daily swings can be meaningful even without a major headline. That makes the current setup less about tiny fluctuations and more about whether the stock can absorb volatility while staying above nearby support. Bollinger Bands reinforce that point. The bands are in a normal 9.0% width, which argues against an imminent squeeze or explosive compression setup, while %B at 70% shows price is trading in the upper portion of the band structure, but not at an extreme. The upper band at 1,224.14 is close enough to act as a near-term ceiling.
Volume adds a constructive note. Last session volume of 3,421,100 was about 1.3x normal, and OBV is rising. That matters because rising OBV means volume is more often accompanying advances than declines, a sign that the latest push higher has participation rather than being just a thin bounce. Still, the market has not yet forced a breakout above resistance, so participation is supportive rather than decisive.
Key Levels & Scenarios
The key battle is between 1,220.66 resistance and 1,115.68 support. If the stock can clear the resistance zone and hold above the 1,224.14 upper Bollinger band, the chart would begin to look more like a continuation move than a range trade. If it fails there, the market may drift back toward the mid-band at 1,171.30, which now acts as the technical pivot between strength and indecision. A drop through 1,115.68 would weaken the current structure and expose the lower band at 1,118.46 as a nearby reference point for downside pressure.
The broader message is that LLY is in a recovery phase with improving participation, but the indicators are not fully aligned yet. Price is above the averages, volume is supportive, but MACD is still negative and the trend remains sideways. That is a credible setup, not a confirmed breakout.
Technical Verdict: HOLD (wait & see)
- Reason 1: Price is above SMA20 at 1,171.30 and SMA50 at 1,155.49, which supports the current base.
- Reason 2: OBV is rising and volume is running at 1.3x normal, showing participation in the rebound.
- Reason 3: MACD histogram is -4.458, so momentum has not fully confirmed the price strength; the trend is still sideways.
- Verdict invalidated if price falls below 1,115.68, the stated support level.
- Ideal Entry Range: 1,171.30 to 1,191.94
- Exit Target: 1,220.66 to 1,224.14
- Stop Loss protection: below 1,115.68
For readers outside the trading world: the stock is holding up, but it has not yet proved that the recent strength is strong enough to call a clean trend.
“It’s holding, but it still has to earn the breakout.”
Summary Data LLY
| Last price | 1,191.94 USD |
| Change 1 day / 5 days / 1 month | 1.89% / 3.20% / -2.06% |
| Trend / MA-cross | sideways / none |
| SMA20 / SMA50 | 1,171.30 / 1,155.49 |
| RSI (14) / Stochastic %K | 55.0 / 67.4 |
| Bollinger %B / ATR | 70% / 41.94 |
| Support / Resistance 20 days | 1,115.68 / 1,220.66 |
| Data as of | 6 Agustus 2026 20:30 WIB |



