T Stock Gains 0.04%, Testing Support Level In Focus
On September 21, 2026: price 25.40 USD, trend sideways, RSI 50.4, support 25.15, resistance 26.72. technical analysis of t stock. Stock Gains — full details…

AT&T ended at 25.40 USD on 18 September 2026, barely changed from the previous close, but the real message is in the chart: the stock is drifting just under its short-term average while volume has surged to 2.3× its 20-day norm. That combination usually means the market is paying attention, even if price itself is not yet committing to a clear direction.
Trend & Price Action
The broader structure is still best described as sideways, with the SMA20 at 25.80 sitting above the current price and the SMA50 at 24.37 below it. In plain terms, AT&T is caught between short-term softness and medium-term support. It is not in a clean uptrend because price is below the 20-day average, but it has also not broken down through the 50-day line, which keeps the chart from turning decisively bearish.
As shown in the chart, the stock is trading near the lower half of its recent range, but not at the edge of collapse. The 20-day support at 25.15 is close enough to matter, because a move below it would show that buyers are no longer defending the recent floor. On the other side, 26.72 resistance remains the first barrier that would need to be reclaimed before the market could argue for a stronger recovery. The fact that price sits 16% of the way up the 20-day range suggests there is still room for either a bounce or another leg lower.
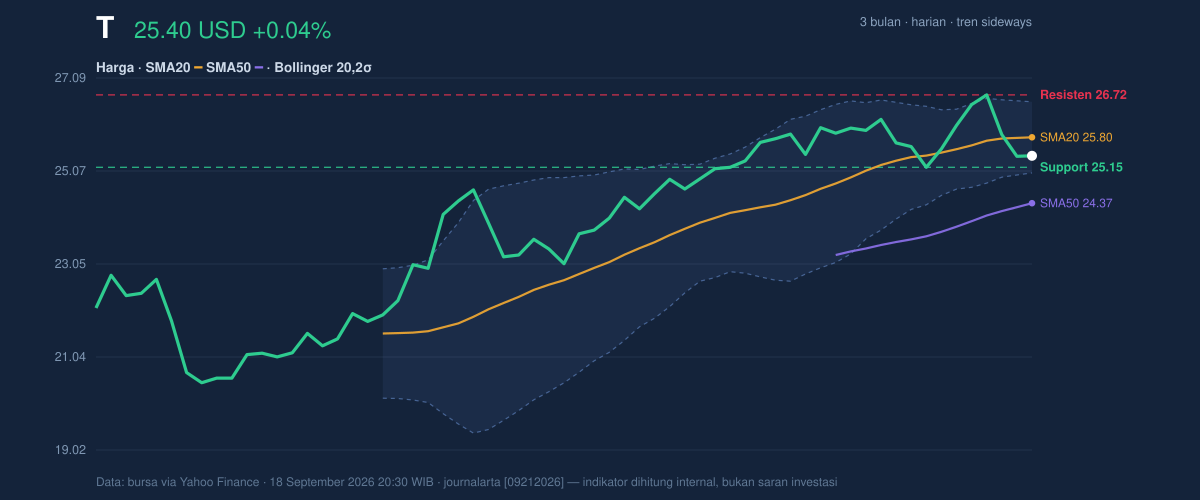
The Bollinger Bands add an important nuance. The band width has narrowed to 6.0%, which is a squeeze. That matters because squeezes often come before larger moves; they do not predict direction, but they do warn that the current calm may not last. With price at %B 24%, AT&T is positioned in the lower part of its Bollinger envelope, meaning the stock is trading closer to the lower band than the upper band. That is a sign of pressure, but not yet a breakdown.
Oscillators & Momentum
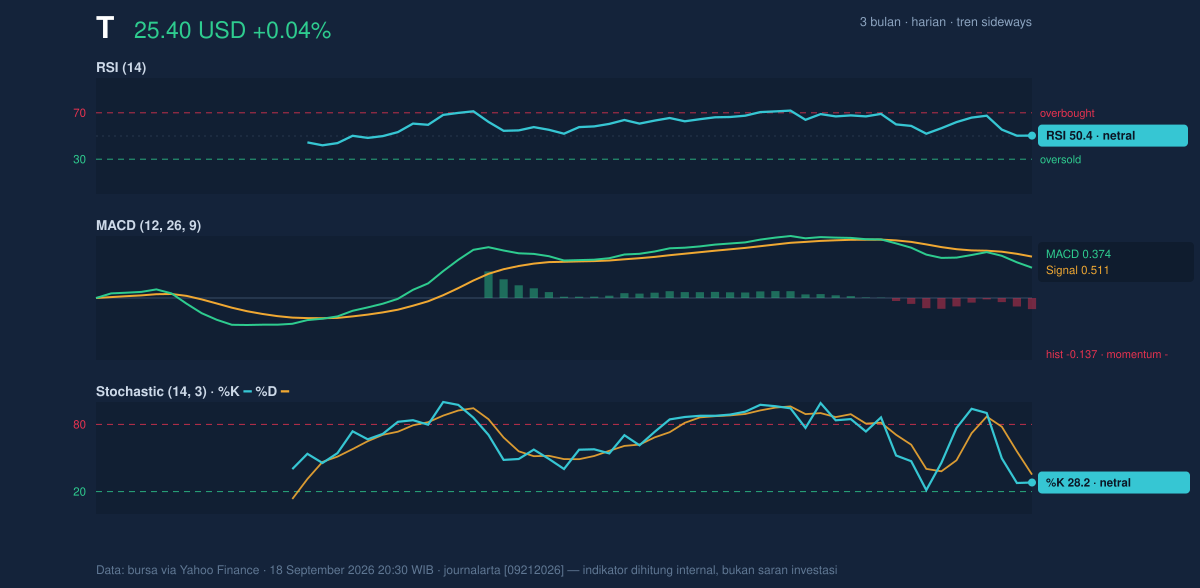
Momentum is mixed rather than decisive. The RSI at 50.4 is neutral, which tells investors the stock is neither overbought nor oversold. That sounds bland, but it is useful: the market is balanced enough that a new catalyst could tilt it quickly. The Stochastic %K at 28.2 and %D at 35.2 are also neutral, though they lean toward the weaker side of the scale. In practical terms, that means short-term momentum has cooled, but it has not yet reached a deeply oversold condition that would usually force a rebound.
The more cautionary signal comes from MACD. The MACD at 0.374 remains below the signal line at 0.511, leaving a -0.137 histogram. That setup signals negative momentum: the trend is not falling apart, but the recent pace of price movement is weaker than the underlying average. When MACD lags below its signal line while price sits under SMA20, it often suggests the stock needs either stronger buying or more time before it can reassert direction.
Volatility & Volume
Volatility is moderate, with ATR(14) at 0.61, or 2.4% of price. That tells readers the stock is capable of moving, but not in a wild, disorderly fashion. Combined with the Bollinger squeeze, this points to a market that is compressing rather than expanding right now. Compression is important because it often precedes the next meaningful move; the question is whether that move comes from buyers regaining control or sellers pressing the stock through support.
Volume gives the current setup extra weight. The latest print of 84,345,600 shares is far above the 36,399,510 average, and OBV is rising. That matters because rising OBV means the cumulative volume trend is improving even if price has not yet fully responded. In other words, there is participation behind the stock. The market is not ignoring AT&T; it is accumulating or rotating into it in a way that has not yet translated into a clean price breakout.
Key Levels & Scenarios
The immediate map is straightforward. 25.15 is the nearest support and the first line that bulls need to defend. A failure there would expose the lower Bollinger band at 25.03, which is important because it sits just under support and would likely be watched as a technical trigger for further weakness. Above current levels, 25.80 is the SMA20 and the middle Bollinger band, so it acts as a pivot. Reclaiming it would improve the short-term tone. Above that, 26.72 resistance is the main hurdle; a move through it would show that the recent squeeze is resolving upward rather than fading.
The 3-month range helps frame the bigger picture. The stock has traded between 26.93 and 19.89, so the current price is much closer to the upper end of that span than the lower end. That is not a bearish backdrop by itself, but it does mean the stock has already recovered a meaningful amount from the low and may need fresh evidence to extend higher.
Technical Verdict: HOLD (wait & see)
HOLD (wait & see) fits the chart because the signals are split: price is below SMA20 at 25.80 and MACD is negative, but OBV is rising and SMA50 at 24.37 is still below price, which keeps the medium-term structure intact.
- Reason 1: RSI 50.4 and Stochastic 28.2 / 35.2 are neutral, so momentum is not strong enough to confirm a breakout or breakdown.
- Reason 2: MACD 0.374 below signal 0.511 and the -0.137 histogram point to negative short-term momentum.
- Reason 3: The 6.0% Bollinger squeeze and 2.3× volume surge suggest a larger move may be building, but direction is still unclear.
- Invalidation: this verdict is invalidated if price falls below 25.15 and then loses the 25.03 lower Bollinger band.
- Ideal entry range: 25.15 to 25.80
- Exit target: 26.72
- Stop loss protection: below 25.03
For non-traders, this means AT&T is not sending a clean go-ahead or warning signal yet, but the next move could matter more than the last few quiet sessions.
Summary Data T
| Last price | 25.40 USD |
| Change 1 day / 5 days / 1 month | 0.04% / -2.53% / 0.99% |
| Trend / MA-cross | sideways / none |
| SMA20 / SMA50 | 25.80 / 24.37 |
| RSI (14) / Stochastic %K | 50.4 / 28.2 |
| Bollinger %B / ATR | 24% / 0.61 |
| Support / Resistance 20 days | 25.15 / 26.72 |
| Data as of | 18 September 2026 20:30 WIB |



