LLY Stock Analysis: Gains 0.04%, Momentum Weakens
On September 21, 2026: price 1,152.93 USD, trend downtrend, RSI 47.7, support 1,115.70, resistance 1,255.40. technical analysis of lly stock.

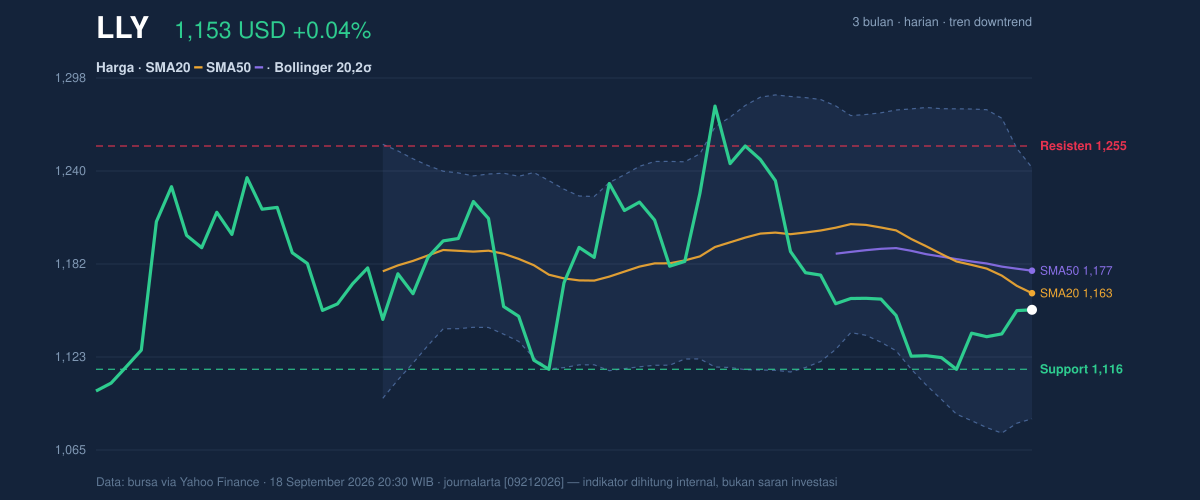
Eli Lilly’s shares were little changed in New York on Thursday, with the stock last trading at US$1,152.93, up 0.04% from the previous close, but the quieter headline masks a more cautious technical picture. The chart shows a name that is still trading above its recent floor, yet remains pinned below the 20-day moving average and below the 50-day moving average, a combination that usually signals a market still trying to regain trend control rather than one already back in command.
Trend & Price Action
The broader setup remains a downtrend, and that matters more than the flat daily move. The SMA20 at US$1,163.31 is sitting above the current price, while the SMA50 at US$1,177.36 is also overhead. In plain terms, short-term and medium-term trend lines are both acting as resistance, which tells traders that recent rebounds have not yet been strong enough to change the market’s direction.
The slope of the SMA20 at -1.67% over five days reinforces that message. A falling moving average is not just a line on a chart; it means the average price over the last month is still drifting lower, so rallies are being sold into faster than they are being absorbed. There is no fresh moving-average crossover, which reduces the odds of a near-term trend reversal signal. As shown in the chart, the price is also sitting at only 27% of the 20-hour range, leaving it closer to support than resistance, but not yet close enough to imply a decisive recovery.
Oscillators & Momentum
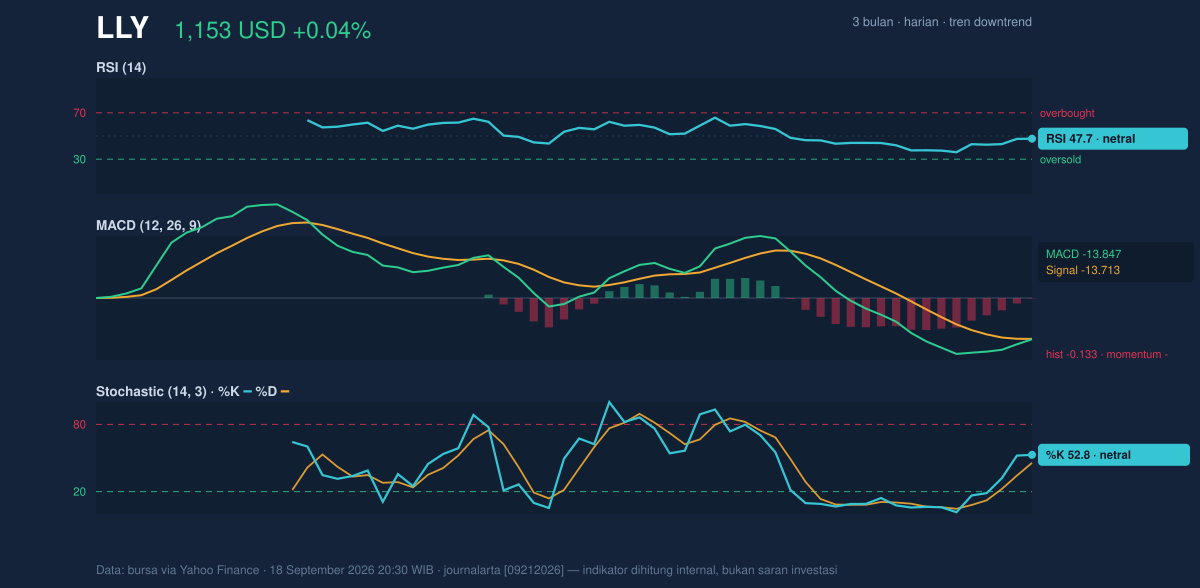
Momentum is mixed rather than broken, and that nuance is important. The RSI at 47.7 is neutral, which means the stock is neither stretched to the upside nor washed out on the downside. That usually signals indecision: the market is not screaming “oversold bargain,” but it is also not flashing an overbought warning. The Stochastic reading of %K 52.8 and %D 45.6 is also neutral, but with %K above %D, there is a modest short-term improvement in momentum.
The more cautionary signal comes from the MACD at -13.847, still below its signal line at -13.713, with a negative histogram of -0.133. For general readers, MACD compares shorter- and longer-term trend strength; when it stays below the signal line, it suggests downside momentum is still slightly dominant even if the stock is not falling sharply day to day. That is why the chart’s neutral oscillators do not yet outweigh the broader downtrend. As shown in the momentum panel, the stock is stabilizing, but not convincingly reversing.
Volatility & Volume
Volatility is present, but not extreme. The ATR(14) of 25.50 equals about 2.2% of price, which points to a market that can move meaningfully without becoming disorderly. The Bollinger Bands add another layer of context: the middle band sits at US$1,163.31, the upper band at US$1,241.90, and the lower band at US$1,084.72. With %B at 43% and band width at 13.5%, the stock is trading below the midline but not near the lower band, suggesting it is neither in a breakout phase nor in a volatility squeeze that usually precedes a sharp move.
Volume, however, is a more constructive clue. The latest session’s volume of 4,542,600 was about 1.9 times the 20-hour average of 2,374,140, and OBV is rising. That combination usually means participation is improving even while price remains under pressure. In other words, more shares are changing hands, and the balance of that trading has been enough to lift the cumulative volume trend. That does not guarantee a reversal, but it does suggest the selloff is not happening in a vacuum.
Key Levels & Scenarios
The nearest technical floor is US$1,115.70, the 20-hour support. If that level holds, the stock can continue to base and attempt a move back toward the moving averages. Below that, the next important marker is the Bollinger lower band at US$1,084.72, which sits close to the 3-month low of US$1,079.22. That zone is the line between a routine pullback and a deeper technical breakdown.
On the upside, US$1,255.40 is the immediate resistance from the 20-hour range, and above that the chart would need to challenge the 3-month high of US$1,292.65 to restore stronger trend confidence. The key point is that the stock is currently trapped between a tested support band and a cluster of overhead resistance, with the price still below both major moving averages. That is why the market is waiting for proof, not just a bounce.
Technical Verdict: HOLD (wait & see)
HOLD (wait & see)
- MACD remains negative, which says downside momentum is still slightly in control.
- Price is below SMA20 and SMA50, so the short- and medium-term trend has not yet flipped.
- Volume is 1.9× average and OBV is rising, which argues that buyers are reappearing, but not yet enough to confirm a reversal.
Verdict invalidated if price falls below US$1,084.72, the lower Bollinger Band and the next major technical floor.
- Ideal entry range: US$1,115.70 to US$1,163.31
- Exit target: US$1,241.90 to US$1,255.40
- Stop loss protection: below US$1,084.72
In plain English: the stock is trying to stabilize, but it has not yet proven that the downtrend is over.
“This is the kind of chart that asks for patience, because the next move could matter more than the last one.”
Summary Data LLY
| Last price | 1,152.93 USD |
| Change 1 day / 5 days / 1 month | 0.04% / 3.34% / -7.35% |
| Trend / MA-cross | downtrend / none |
| SMA20 / SMA50 | 1,163.31 / 1,177.36 |
| RSI (14) / Stochastic %K | 47.7 / 52.8 |
| Bollinger %B / ATR | 43% / 25.50 |
| Support / Resistance 20 days | 1,115.70 / 1,255.40 |
| Data as of | 18 September 2026 20:30 WIB |



