PDD Momentum Weakens: Stock Gains 1.51% (September 21, 2026)
On September 21, 2026: price 78.90 USD, trend downtrend, RSI 39.5, support 77.73, resistance 88.38. technical analysis of pdd stock. PDD Momentum Weakens —…

PDD Holdings is trying to stabilize after a sharp monthly slide, but the chart still leans defensive: the stock closed at 78.90 USD, up 1.51% on the day, yet remains well below its short- and medium-term trend markers. For international readers, the key issue is not the one-day bounce but whether this rebound can survive inside a broader downtrend.
Trend & Price Action
As shown in the chart, PDD is trading below its SMA20 at 82.02 and below its SMA50 at 85.12, which tells traders the stock is still priced under both its near-term and intermediate trend lines. That matters because moving averages often act like a market’s memory: when price stays underneath them, rallies tend to be treated as recovery attempts rather than confirmed trend reversals.
The slope of the SMA20 is -2.72% over 5 days, a clear sign that the recent direction is still downward. There is also no fresh MA-cross, so there is no technical evidence yet that short-term momentum has overtaken the longer trend. In plain language, the market has not produced the kind of crossover that would usually suggest a meaningful shift in control.
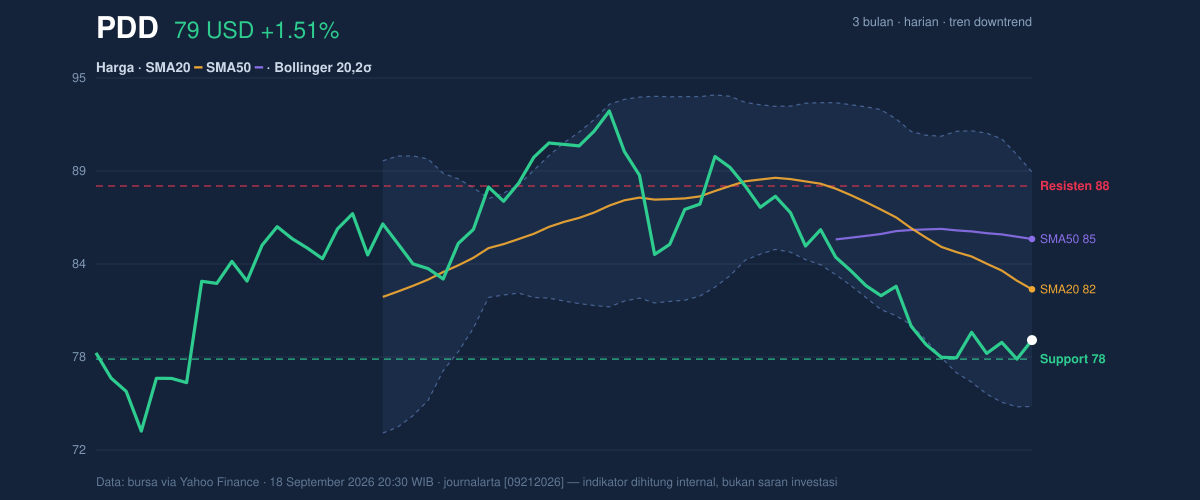
Price is sitting at 78.90 USD, which is only about 11% of the way up the 20-hour range between 77.73 and 88.38. That positioning is important: the stock is closer to support than resistance, but not so close to support that it looks fully washed out. It is still in the middle of a fragile zone where a small move can decide whether the recent bounce is just noise or the start of a base.
The broader context is also mixed. PDD is trading above the 3-month low of 71.94, but still below the 3-month high of 93.19. That leaves the stock in the lower half of its recent range, which usually signals that sellers have not been fully cleared out.
Oscillators & Momentum
The momentum picture is less bearish than the trend picture, but not bullish enough to override it. The RSI at 39.5 is technically neutral, though it sits below the midpoint that often separates constructive momentum from weak momentum. That means the stock is not oversold in a dramatic sense, but it is still carrying the weight of recent selling.
The Stochastic readings of %K 20.8 and %D 14.1 are also neutral, but they sit near the lower end of the range. This usually suggests the stock is closer to a rebound zone than an overheated one, yet it does not confirm that buyers have seized control. In other words, the oscillator is signaling exhaustion in the selloff, not a full reversal.
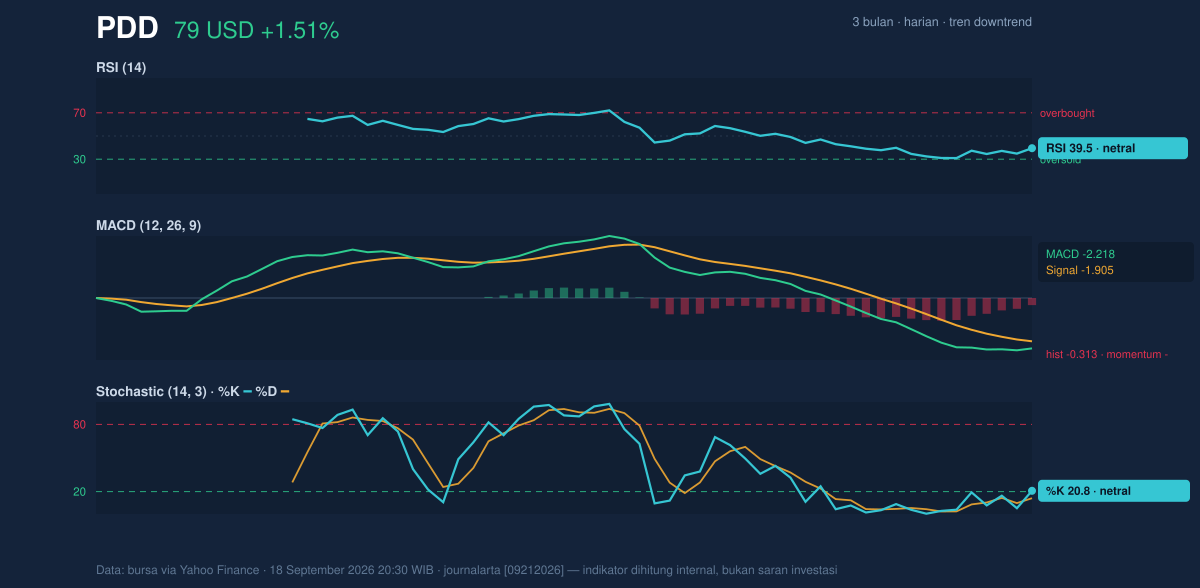
The more decisive signal comes from MACD. With MACD at -2.218, below the signal line at -1.905, and a negative histogram of -0.313, momentum remains negative. That setup means the trend is still losing altitude faster than it is recovering, even if the daily price change looks positive. For readers unfamiliar with the indicator, the histogram shows the distance between the MACD line and its signal line; a negative reading means downside pressure still dominates.
Volatility & Volume
Bollinger Bands show price trading in the lower part of its recent envelope. The stock is below the middle band at 82.02 and well under the upper band at 89.24, while the lower band sits at 74.81. The %B reading of 28% suggests price is hugging the lower side of the band structure, which often happens when a stock is under pressure but not yet breaking down decisively.
The Bollinger band width of 17.6% is described as normal, so this is not a classic squeeze where volatility is compressed and a sharp move is likely to erupt. Instead, the market appears to be in a regular volatility regime, which makes follow-through less explosive but also less predictable.
ATR adds another layer. The ATR(14) of 1.71, equal to 2.2% of price, points to moderate daily movement. That means PDD can still swing meaningfully in either direction, but the tape is not showing extreme disorder. Volume supports that reading: 8,192,400 shares traded versus a 20-day average of 7,490,645, or 1.1x normal. Participation is slightly above average, which helps validate the day’s rebound, but the OBV is falling, and that is a warning sign. On-balance volume tracks whether money is accumulating or leaving over time; a falling OBV while price bounces suggests the rally may still lack broad sponsorship.
Key Levels & Scenarios
The nearest reference point is support at 77.73, almost directly beneath the last close. That makes it the first line of defense for bulls trying to build a floor. If that level gives way, the chart would likely test the lower Bollinger boundary at 74.81, and the market would be showing that recent stabilization failed to hold.
On the upside, resistance at 88.38 is the first meaningful barrier. A move through that level would matter because it would place price back into the upper half of the recent range and begin to challenge the idea that the stock is locked in a downtrend. Beyond that, the SMA20 at 82.02 and SMA50 at 85.12 remain important checkpoints; reclaiming them would be an early sign that the trend is improving rather than merely bouncing.
Technical Verdict: HOLD (wait & see)
HOLD (wait & see)
- MACD remains negative, with the line below its signal and a negative histogram, so downside momentum is still present.
- Price is below both SMA20 and SMA50, and the SMA20 slope is still falling, which keeps the broader trend under pressure.
- Volume is only 1.1x normal while OBV is declining, so the rebound does not yet look strongly confirmed.
Verdict invalidated if price falls below 77.73 and fails to hold the lower band area.
- Ideal Entry Range: 77.73 to 82.02
- Exit Target: 85.12 to 88.38
- Stop Loss protection: below 74.81
For non-traders, this means the stock is trying to recover, but the chart has not yet proven that the sellers are finished. The next close around 77.73 will show whether this rebound has real footing or just short-lived relief.
Summary Data PDD
| Last price | 78.90 USD |
| Change 1 day / 5 days / 1 month | 1.51% / 1.40% / -11.86% |
| Trend / MA-cross | downtrend / none |
| SMA20 / SMA50 | 82.02 / 85.12 |
| RSI (14) / Stochastic %K | 39.5 / 20.8 |
| Bollinger %B / ATR | 28% / 1.71 |
| Support / Resistance 20 days | 77.73 / 88.38 |
| Data as of | 18 September 2026 20:30 WIB |



