JPM Stock Analysis: Gains 0.10%, Testing Support Level
On September 21, 2026: price 349.67 USD, trend sideways, RSI 44.2, support 348.92, resistance 362.06. technical analysis of jpm stock. JPM Stock Analysis —…

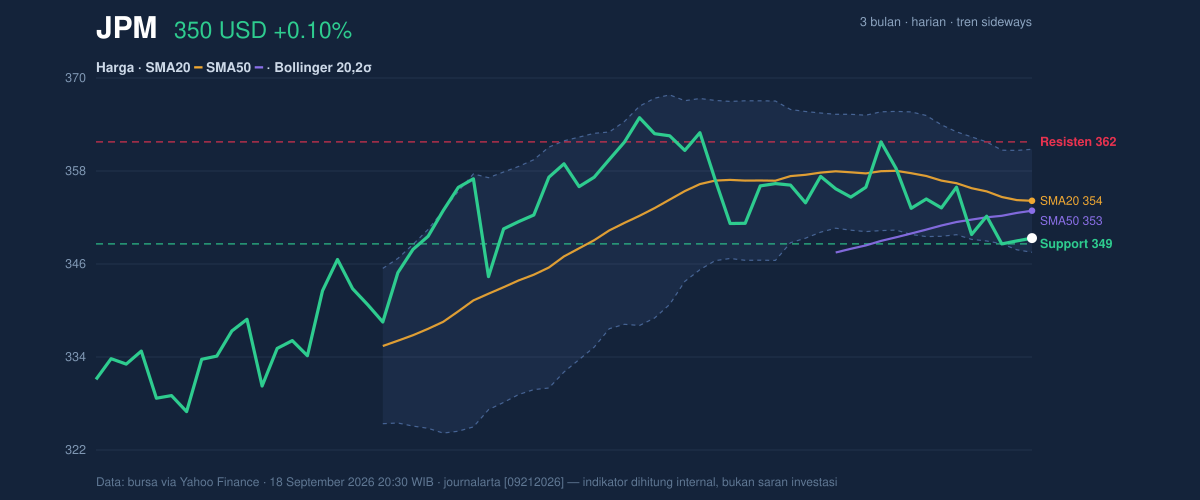
JPMorgan Chase traded at 349.67 USD on the NYSE on 18 September 2026, just above the prior close of 349.31. The move looks modest on the surface, but the chart is telling a more nuanced story: the shares are sitting below the SMA20 at 354.47 and below the SMA50 at 353.20, while volume surged to 18,290,400, about 2.6× the 20-session average. That combination usually means traders are active, but they are not yet agreeing on direction.
Trend & Price Action
The broader structure remains sideways, and the slope of the SMA20 at -0.64% over 5 days shows the short-term trend is still leaning lower rather than stabilizing. JPM’s price is trading in the lower part of its recent range, with the stock only 6% of the way up from the 20-hour support at 348.92 toward resistance at 362.06. That positioning matters: when a stock sits near the bottom of a range while moving averages are above price, rallies often face supply from traders who bought earlier and are looking to exit near breakeven.
The Bollinger Bands reinforce that reading. Price is below the middle band at 354.47 and near the lower band at 347.84, with %B at 14%. In plain English, that means JPM is pressing the lower end of its recent volatility envelope, not stretched on the upside. The band width of 3.7% is also narrow, a classic squeeze signal that often precedes a sharper move. As shown in the chart, the squeeze does not say which way the break will go; it says the market is storing energy.
Oscillators & Momentum
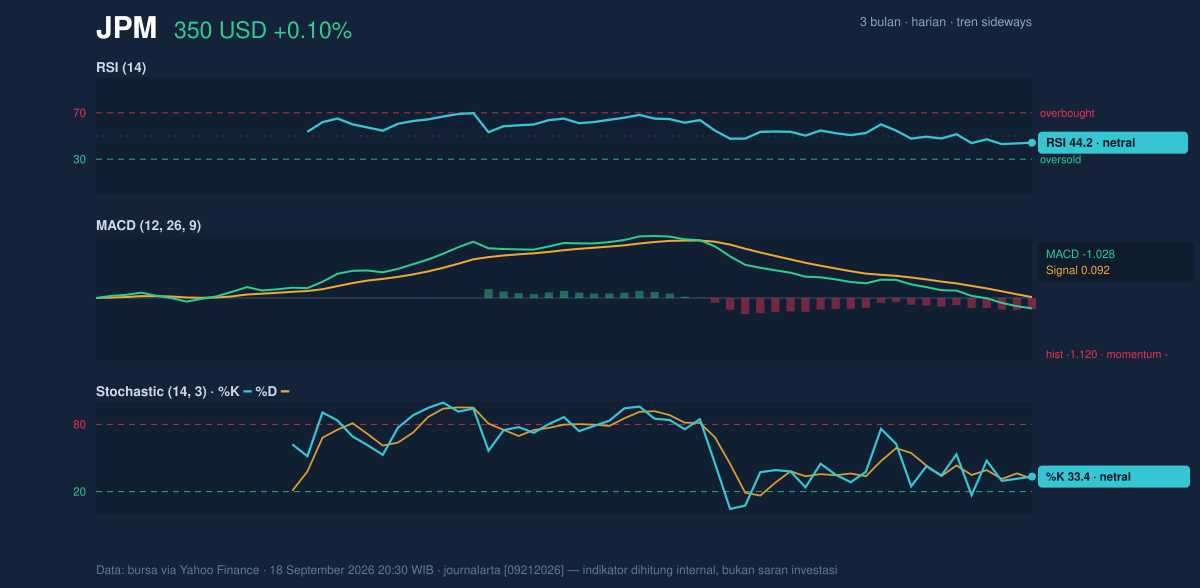
Momentum is not confirming a rebound yet. The RSI at 44.2 is neutral, which means the stock is neither oversold nor overbought and still has room to move either way. The stochastic reading, with %K at 33.4 and %D at 31.5, is also neutral but slightly low in the range, which suggests price is not under strong buying pressure. More importantly, the MACD is negative: MACD -1.028 versus signal 0.092, with a histogram of -1.120. That gap shows downside momentum is still ahead of the signal line, a sign that recent price action has not yet turned decisively positive.
The message from these oscillators is not panic; it is hesitation. RSI and stochastic are not flashing oversold extremes that would typically invite a sharp reflex bounce, while MACD says the short-term trend remains under pressure. As shown in the chart, the indicators are aligned more with a pause inside a weak range than with a clean reversal.
Volatility & Volume
ATR(14) stands at 7.00, or about 2.0% of price, which points to moderate volatility. That means daily swings are present, but not extreme. Combined with the Bollinger squeeze, this suggests the stock may be coiling rather than trending strongly right now.
Volume is the most interesting counterweight to the weak momentum picture. The latest print of 18,290,400 shares is far above the 6,929,755 average, and OBV is rising. OBV, or on-balance volume, tracks whether volume is flowing in on up days or out on down days; a rising line implies accumulation pressure is building even if price has not yet broken out. In other words, the tape is busier than the trend would suggest. That can be a warning of distribution, but in this case the rising OBV argues that some buyers are still stepping in despite price trading below the moving averages.
Key Levels & Scenarios
The nearest support is 348.92, almost directly under the current price. That makes it a critical floor: if it holds, JPM can continue to base inside the tight range and test the middle band at 354.47 and then the resistance zone at 362.06. The 20-hour resistance is especially important because it sits just below the 3-month high of 366.50, a level that would likely attract attention if momentum improves.
If 348.92 fails, the next reference is the lower Bollinger band at 347.84. A break below that would suggest the squeeze is resolving lower, not higher, and would put the stock closer to the 3-month low of 325.01 than to the recent highs. If price can reclaim the SMA20 at 354.47, the chart would begin to look less defensive, but it would still need to clear 362.06 to show that buyers have genuinely absorbed overhead supply.
Technical Verdict: HOLD (wait & see)
HOLD (wait & see) fits the current setup because the chart is compressed but not yet directional: price is below the SMA20 and SMA50, MACD remains negative, and RSI is neutral rather than oversold. At the same time, volume is running 2.6× average and OBV is rising, which means participation is real and a breakout could form if buyers take control. The Bollinger squeeze adds to that “wait for confirmation” message.
- Ideal Entry Range: 348.92 to 354.47
- Exit Target: 362.06, with 366.50 as the next chart reference if resistance gives way
- Stop Loss Protection: below 347.84, with 325.01 as the deeper downside reference
- Verdict invalidated if price falls below 347.84
For non-traders: JPM is not showing a clean trend right now, but it is close to a level where the next move could become much more decisive.
JPM’s 3-month high is 366.50 and its 3-month low is 325.01.
Summary Data JPM
| Last price | 349.67 USD |
| Change 1 day / 5 days / 1 month | 0.10% / -1.84% / -0.53% |
| Trend / MA-cross | sideways / none |
| SMA20 / SMA50 | 354.47 / 353.20 |
| RSI (14) / Stochastic %K | 44.2 / 33.4 |
| Bollinger %B / ATR | 14% / 7.00 |
| Support / Resistance 20 days | 348.92 / 362.06 |
| Data as of | 18 September 2026 20:30 WIB |



