XOM Stock Analysis: Gains 0.17%, Momentum Weakens
On September 21, 2026: price 163.54 USD, trend sideways, RSI 53.8, support 156.44, resistance 169.32. technical analysis of xom stock. XOM Stock Analysis —…

ExxonMobil’s shares rose to 163.54 USD on the NYSE on 18 September 2026, a modest daily gain that leaves the stock above its 20-day average of 162.66 and well above the 50-day average of 157.79. The move matters less for its size than for what it says about positioning: XOM is still trading in a sideways trend, but buyers have kept price above short-term trend support even as momentum indicators remain mixed. As shown in the chart, the stock sits in the upper half of its recent range, yet it has not broken into a clear directional advance.
Trend & Price Action
Price structure is constructive, but only moderately so. XOM’s price above SMA20 and wider gap over SMA50 show that the medium-term trend is still intact, while the 0.20% five-day slope in SMA20 suggests the short-term drift is upward, not accelerating. That combination usually signals a market that is holding gains rather than building a strong breakout. The absence of a fresh MA-cross also matters: without a new crossover, the chart is not delivering a strong trend-change signal, only confirmation that the stock has recovered from earlier weakness. With the shares at 55% of the 20-hour range, the market is balanced rather than stretched.
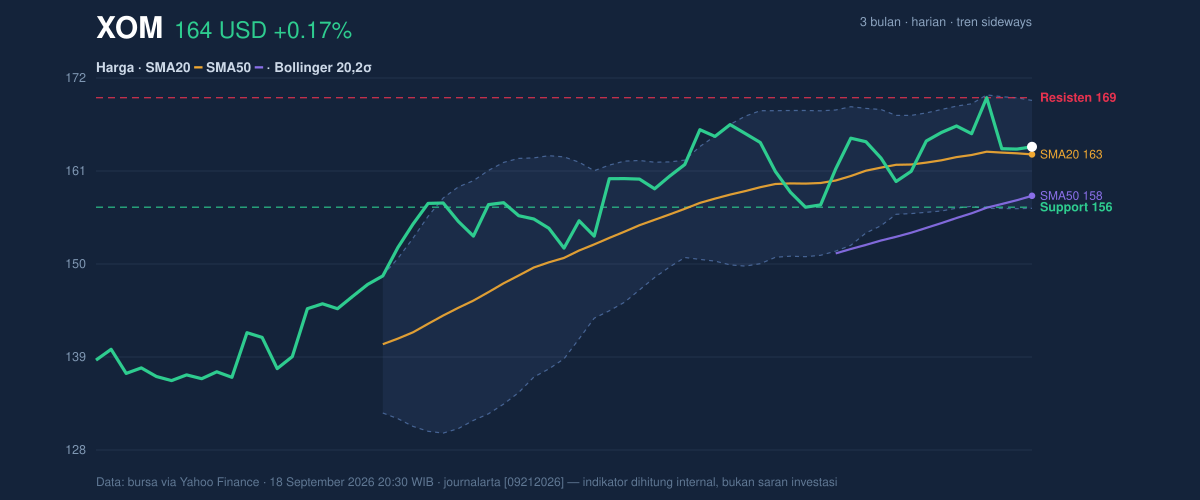
The broader range adds context. The stock’s three-month high of 169.64 is close enough to act as a ceiling, while the three-month low of 134.95 shows how far the shares have already repaired from the lower end of the range. In plain terms, XOM is no longer in rebound territory, but it also has not yet proven it can escape the band it has been trading in.
Oscillators & Momentum
Momentum is where the chart becomes less decisive. The RSI at 53.8 is neutral, which means the stock is neither overbought nor oversold and gives no strong warning of exhaustion. The Stochastic reading of 44.0 versus 51.8 is also neutral, but it leans softer than RSI, hinting that recent upside has not yet translated into full momentum confirmation. That gap is important: when stochastic lags while price stays firm, it often means the move is steady but not forceful.
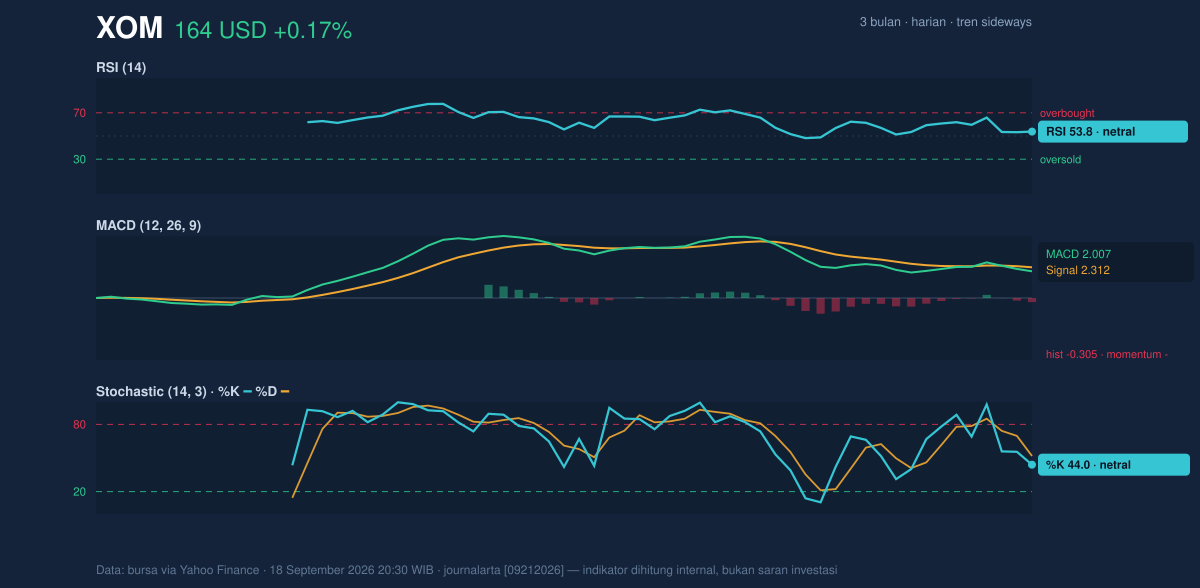
The clearest caution comes from the MACD at 2.007 below its signal line at 2.312, with a -0.305 histogram. For general readers, that means the trend is still positive on the broader chart, but the pace of that trend has slipped below the level needed to confirm fresh upside momentum. In practical terms, MACD is saying the stock can hold its ground, yet it has not fully re-accelerated after the recent pause.
Volatility & Volume
Volatility is not elevated, but it is becoming more interesting. The Bollinger band width of 7.8% points to a squeeze, which often precedes a larger move because price has been compressing inside a tighter corridor. The stock’s %B at 57% places it slightly above the middle of the band, consistent with a market leaning upward without pressing into extreme territory. Since the upper band is 169.00 and the lower band is 156.31, the current setup suggests the next meaningful move may be toward one edge of that envelope rather than staying stuck near the center.
Volume gives the compression setup more credibility. Last trade volume of 37,605,100 was about 2.5 times the 20-day average of 14,807,770, and OBV is rising. That combination usually means the market is not drifting on thin participation; rather, more shares are changing hands while price remains firm. Rising OBV is especially useful because it suggests accumulation pressure is still present even though MACD has turned softer. The message is not “strong breakout already,” but “the stock is being supported well enough that a breakout attempt would not be surprising.”
Key Levels & Scenarios
The nearest technical map is clear. Support at 156.44 sits close to the lower Bollinger band at 156.31, creating a tight floor where buyers have been active. On the upside, resistance at 169.32 is just under the three-month high of 169.64 and near the 169.00 upper Bollinger band, so the market is approaching a zone where supply has previously appeared. That clustering of resistance levels matters: if XOM fails there, it would reinforce the idea that the stock is still range-bound. If it clears that area, the squeeze setup suggests the move could expand quickly.
As shown in the chart, the current price is not far from either edge of the recent band, which makes the next move more important than the last one. The stock is sitting in a compression zone where trend support is holding, momentum is mixed, and participation is strong enough to justify attention.
Technical Verdict: HOLD (wait & see)
HOLD (wait & see) fits best because the chart is constructive but not yet decisive. Price is above SMA20 and SMA50, which keeps the trend structure positive, but MACD remains below its signal line, showing momentum has not fully confirmed the move. The Bollinger squeeze and 2.5× volume jump suggest a larger move may be brewing, yet the stock is still boxed in by nearby resistance.
- Ideal entry range: 156.44 to 162.66, using support and the 20-day average as the lower and middle technical anchors.
- Exit target: 169.32 to 169.64, based on resistance and the recent three-month high.
- Stop loss protection: below 156.31, aligned with the lower Bollinger band and close to support.
This means the stock is holding up, but the chart still wants proof before it can be called a clean breakout.
Latest watchpoint: the next test is whether ExxonMobil can push through 169.32 without losing the 156.44 support zone first.
Summary Data XOM
| Last price | 163.54 USD |
| Change 1 day / 5 days / 1 month | 0.17% / -1.48% / -1.57% |
| Trend / MA-cross | sideways / none |
| SMA20 / SMA50 | 162.66 / 157.79 |
| RSI (14) / Stochastic %K | 53.8 / 44.0 |
| Bollinger %B / ATR | 57% / 3.89 |
| Support / Resistance 20 days | 156.44 / 169.32 |
| Data as of | 18 September 2026 20:30 WIB |



