Singtel Stock Technicals Today: Drops 2.03%, Testing Support Level
On Agustus 7, 2026: price 4.34 SGD, trend sideways, RSI 43.1, support 4.35, resistance 4.61. technical analysis of singtel stock. Singtel Stock Technicals —…

Singapore Telecom (Singtel) fell to SGD 4.34 on SGX, down from SGD 4.43 previously, as the stock extended a short-term slide while sitting just above its nearest chart floor, according to exchange-based data cited by Yahoo Finance. The move leaves the counter in a technically fragile spot: the price is below the short-term average, momentum is weak, and the market is waiting to see whether the current pause becomes a base or a break.
Trend & Price Action
The broader read is still sideways, but the tape is leaning lower in the near term. Singtel is trading below SMA20 at 4.44 while remaining slightly above SMA50 at 4.39, which usually means the stock has not entered a clean downtrend, yet the immediate trend has lost traction. The lack of a fresh MA-cross matters because it suggests the market has not produced a new medium-term signal; instead, price is drifting between competing timeframes.
That tension shows up in the range position. The stock is sitting near the lower end of its recent band, with the 20-hour support at 4.35 only a fraction below the last price, while 20-hour resistance stands at 4.61. In plain terms, the market is pressing against the lower boundary of the range rather than testing the upper side, which often tells traders that sellers still have the shorter-term advantage.
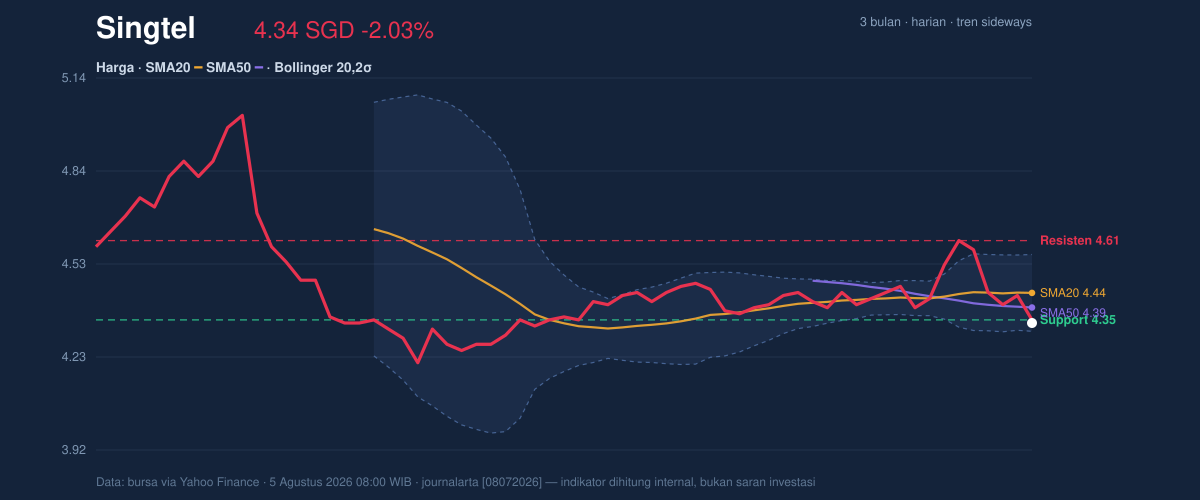
The three-month range adds context. Singtel’s 3-month high is 5.05 and its 3-month low is 4.15, so the stock is trading closer to the lower end of that window than the top. That does not confirm a breakdown on its own, but it does show that the rebound attempt has not yet reclaimed enough ground to reset the chart.
Oscillators & Momentum
The momentum picture is mixed, but not in a comforting way. RSI(14) at 43.1 is neutral, which means the stock is neither stretched upward nor deeply washed out. That reading matters because it leaves room for either direction, but it also says the recent decline has not yet reached an extreme that typically attracts aggressive dip-buying.
By contrast, the Stochastic %K at 2.8 and %D at 13.3 point to oversold conditions. This is a short-term warning that the stock may be stretched on the downside, but oversold does not mean a reversal is guaranteed. It simply means the selloff has moved fast enough that the next move could be a bounce if pressure eases.
The more important confirmation comes from MACD. At 0.004, below the signal line at 0.012, with a -0.008 histogram, momentum is still negative. In practical terms, MACD is saying the recent price action has not yet turned back in favor of buyers, even if the stochastic oscillator is hinting that downside may be getting tired.
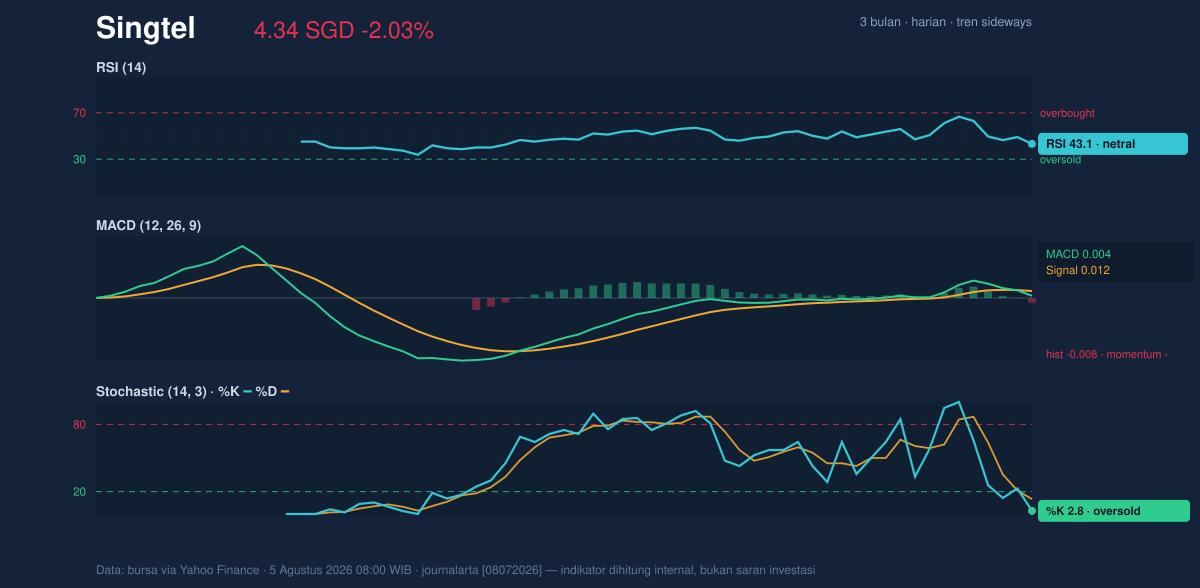
That combination — neutral RSI, oversold stochastic, negative MACD — often appears when a stock is losing speed but has not yet reversed. It is a setup that can produce a bounce, but only if price starts to hold above nearby support and momentum stops deteriorating.
Volatility & Volume
Volatility is moderate, not explosive. The ATR(14) at 0.10, equal to 2.3% of price, suggests normal daily movement rather than a panic phase. That is useful because a stock with moderate ATR can still break out, but it usually needs a catalyst or a clear technical trigger to do so.
The Bollinger Bands offer the clearest clue on what may come next. With the upper band at 4.56, the middle band at 4.44, and the lower band at 4.31, the last price is hovering just above the lower band, and %B at 11% shows it is trading near the bottom of the envelope. More importantly, the 5.7% band width indicates the bands are squeezing, which often precedes a larger move. A squeeze does not tell direction, but it does imply the market is compressing energy.
Volume does not yet confirm a decisive turn. The latest turnover of 31,181,700 is roughly 1.0× the 20-session average of 32,263,100, so participation is basically normal. That means the latest drop is not being accompanied by a dramatic surge in trading interest. Still, OBV is falling, and that matters because On-Balance Volume tracks whether money flow is accumulating or leaving the stock. A falling OBV alongside a soft price trend usually means the market is not yet showing evidence of sustained accumulation.
Key Levels & Scenarios
The near-term structure is straightforward. 4.35 is the first level to watch on the downside, because it is the stated 20-hour support and sits very close to the last price. If that level fails, the chart opens the door toward the lower Bollinger band at 4.31, and then the broader three-month low at 4.15 becomes the next reference point.
On the upside, 4.44 is the middle Bollinger band and also the SMA20, so it acts as the first reclaim level. A move back above that zone would improve the short-term tone. Beyond that, 4.56 — the upper Bollinger band — and 4.61 — the 20-hour resistance — mark the next tests. A push into that area would suggest the squeeze is resolving higher rather than lower.
The key point is that Singtel is not in a clean trend continuation. It is in a compressed range with weakening momentum, which means the next decisive move will likely come from whichever side of the banded structure gives way first.
Technical Verdict: HOLD (wait & see)
HOLD (wait & see)
- MACD is negative, with the line below the signal, so near-term momentum still leans down.
- Stochastic is oversold, which raises bounce potential, but it has not yet been confirmed by price reclaiming the short-term averages.
- Bollinger Bands are squeezing, so the stock is coiled for a move, but direction is still unproven.
- Verdict invalidated if price falls below 4.35, because that would weaken the nearest support and increase the odds of a move toward 4.31.
- Ideal Entry Range: 4.35 to 4.44
- Exit Target: 4.56 to 4.61
- Stop Loss protection: below 4.31
For non-traders, this means the stock is close to support, but the chart has not yet proved that buyers are back in control.
The latest volume was 31,181,700 shares, versus a 20-session average of 32,263,100.
Summary Data Singtel
| Last price | 4.34 SGD |
| Change 1 day / 5 days / 1 month | -2.03% / -5.86% / -0.69% |
| Trend / MA-cross | sideways / none |
| SMA20 / SMA50 | 4.44 / 4.39 |
| RSI (14) / Stochastic %K | 43.1 / 2.8 |
| Bollinger %B / ATR | 11% / 0.10 |
| Support / Resistance 20 days | 4.35 / 4.61 |
| Data as of | 5 Agustus 2026 08:00 WIB |


