XOM Stock Technicals Today: Gains 2.12%, Testing Key Resistance
On Agustus 7, 2026: price 154.84 USD, trend uptrend, RSI 59.7, support 138.88, resistance 156.97. technical analysis of xom stock. XOM Stock Technicals — full…

ExxonMobil’s shares on the NYSE rose to 154.84 USD on 6 August 2026, up 2.12% from the previous close of 151.63, but the chart suggests the move is more of a test of strength than a clean breakout. The stock is still in an uptrend, trading above its SMA20 at 151.36 and SMA50 at 146.38, yet the latest price action is sitting close to a known ceiling rather than in open space. That matters because ExxonMobil is now positioned near the upper end of its recent range, where gains often slow as traders weigh whether momentum can keep pace with the price.
Trend & Price Action
The broader structure remains constructive. The SMA20 is rising 2.61% over 5 days, which means the short-term trend is still pointing higher rather than flattening out. In plain English, that slope tells us buyers have been able to defend higher prices recently, and that tends to support a trend-following market.
Still, the stock is not stretching far beyond its moving averages. With price above both the SMA20 and SMA50, ExxonMobil is trading in a classic bullish alignment, but there has been no new MA-cross to signal a fresh acceleration. The absence of a new crossover suggests the trend is already established, so the market is now looking for confirmation rather than discovery.
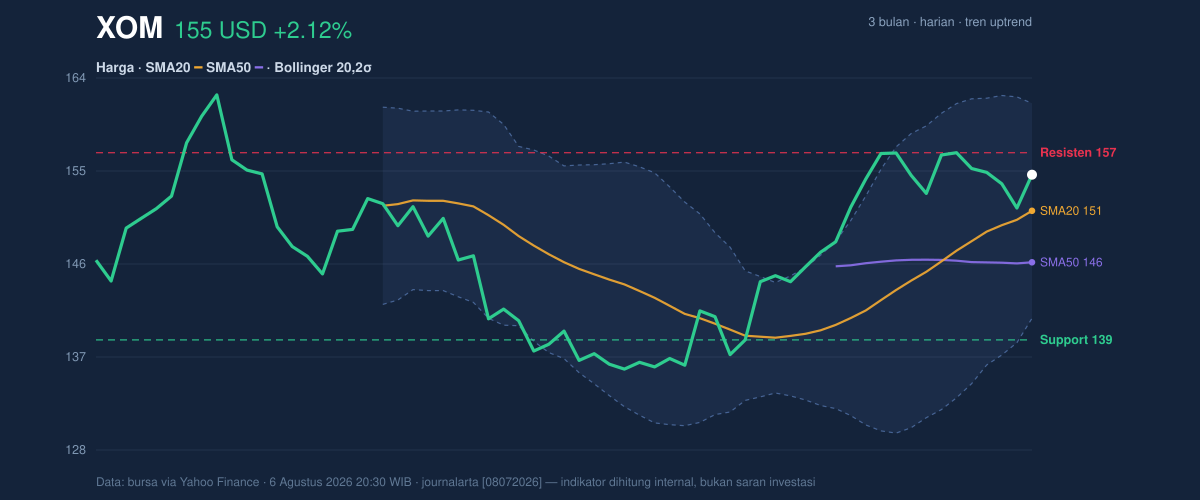
The position inside the Bollinger Bands reinforces that message. The shares are at %B 67%, which means price is in the upper portion of the band but not yet pressing against the top. The upper band sits at 161.74, the middle band at 151.36, and the lower band at 140.97. Because the band width is 13.7% and described as normal, this is not a squeeze setup that usually precedes a violent move. Instead, it looks like a steady trend with room to expand if buyers can keep control.
Oscillators & Momentum
Momentum is more mixed than the trend. The RSI at 59.7 is neutral, which means the stock is not overbought and still has room to advance without immediately running into the usual “too hot” zone. The Stochastic %K at 67.1 and %D at 58.0 are also neutral, showing that short-term momentum is positive but not stretched. For general readers, stochastic measures whether the stock is trading near the top or bottom of its recent range; here, it implies strength, but not a climax.
The caution flag comes from MACD. The MACD at 2.898 remains positive in absolute terms, but it is below the signal line at 2.962, with a histogram of -0.064. That small negative histogram means the trend’s internal momentum has softened even while the price itself is still rising. This is often what a slowing advance looks like: the market can continue higher, but the force behind the move is less decisive than the headline price suggests.
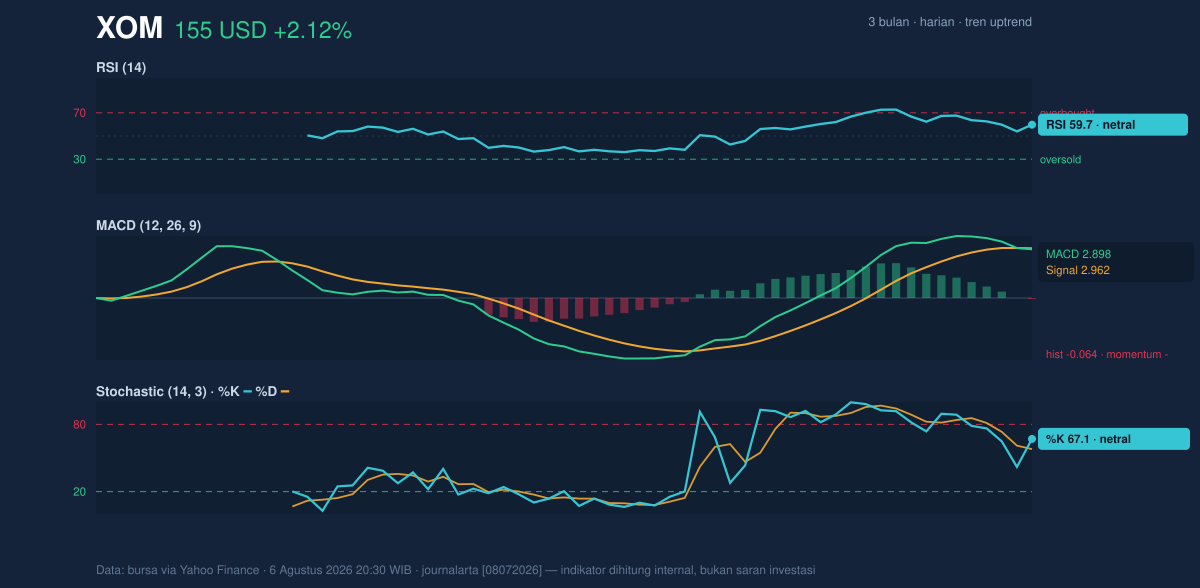
So the oscillator picture is not bearish, but it is not fully synchronized either. The price trend is upward, while MACD is hinting that the pace of that advance is easing. That combination usually calls for patience, because strong trends can keep going even as momentum cools, but they become more vulnerable if price starts failing at resistance.
Volatility & Volume
Volatility is moderate, not explosive. The ATR at 3.98, equal to 2.6% of price, indicates the stock typically moves a few dollars a day rather than swinging wildly. That matters because it frames how quickly a test of resistance or support might unfold. A move through nearby levels should be readable, not chaotic.
Volume is less supportive. The latest session traded 11,874,600 shares versus a 20-day average of 14,183,390, or about 0.8× normal. In market terms, that means the latest gain was not accompanied by above-average participation. Rising prices on lighter volume can still work, but they usually carry less conviction than advances backed by heavy turnover. The OBV is falling, which adds another layer of caution because on-balance volume tracks whether volume is flowing into the stock or away from it. A declining OBV while price holds up suggests distribution pressure may be building beneath the surface.
Key Levels & Scenarios
The nearest technical ceiling is 156.97, the 20-hour resistance level. ExxonMobil is already trading near 88% of its recent range, so this is the area where the market has to prove it can convert proximity into a clean break. Above that, the upper Bollinger band at 161.74 becomes the next visible marker, and the 3-month high at 163.68 is the broader reference point for trend continuation.
On the downside, the first meaningful cushion is the SMA20 at 151.36, which also matches the Bollinger middle band. If that area gives way, the next technical shelf is the 20-hour support at 138.88, with the 3-month low at 134.95 sitting just below as the deeper range floor. The market is therefore balanced between a nearby ceiling and a much lower structural base, which is why the next move matters more than the current one.
Technical Verdict: HOLD (wait & see)
HOLD (wait & see)
- Reason 1: The trend is still positive because price remains above the SMA20 and SMA50, and the SMA20 slope is rising.
- Reason 2: RSI 59.7 and Stochastic 67.1/58.0 are neutral, which supports the trend but does not signal a fresh momentum burst.
- Reason 3: MACD is negative versus its signal line and OBV is down, so participation and momentum are not fully confirming the price rise.
- Verdict invalidated if price breaks below 151.36, because that would weaken the short-term trend and pull the stock back toward the middle of its Bollinger structure.
- Ideal Entry Range: 151.36 to 154.84
- Exit Target: 156.97, then 161.74
- Stop Loss protection: below 138.88
For non-traders, this means ExxonMobil still looks technically firm, but the stock is waiting for stronger confirmation before the next leg becomes convincing.
The next chart watchpoint is whether ExxonMobil can close above 156.97 without losing the 151.36 support zone.
Summary Data XOM
| Last price | 154.84 USD |
| Change 1 day / 5 days / 1 month | 2.12% / -1.36% / 12.64% |
| Trend / MA-cross | uptrend / none |
| SMA20 / SMA50 | 151.36 / 146.38 |
| RSI (14) / Stochastic %K | 59.7 / 67.1 |
| Bollinger %B / ATR | 67% / 3.98 |
| Support / Resistance 20 days | 138.88 / 156.97 |
| Data as of | 6 Agustus 2026 20:30 WIB |



