HSBC Momentum Weakens: Stock Gains 0.69% (Agustus 10, 2026)
On Agustus 10, 2026: price 161.20 HKD, trend uptrend, RSI 55.8, support 152.60, resistance 168.20. technical analysis of hsbc stock. HSBC Momentum Weakens —…

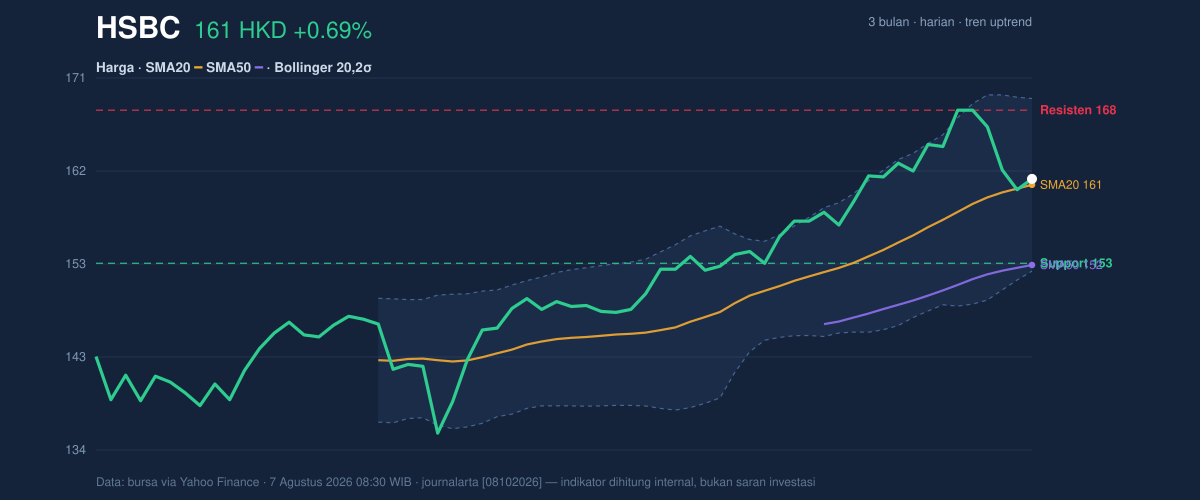
At HK$161.20, HSBC Holdings is still trading above its 20-day average of HK$160.59 and well above its 50-day average of HK$152.43, keeping the broader tape in an uptrend even after a 4.16% drop over 5 days. That mix matters: price is holding the trend line, but the recent pullback says buyers are no longer pressing with the same urgency. The stock is sitting in the middle of its recent range, not at an obvious breakout point and not at a breakdown point either.
Trend & Price Action
The chart shows HSBC is still leaning constructive, but not strongly so. The SMA20 is rising at 1.75% over 5 days, which signals the short-term trend is improving rather than fading. Price above the SMA20 also tells us the latest bounce has not been fully reversed. Yet the absence of a fresh MA-cross means the trend is not being reinforced by a new moving-average signal; in plain terms, the stock is trending, but without a new technical catalyst from the averages.
The more important context is position within the range. HSBC is trading at about 55% of its 20-hour range, with support at HK$152.60 and resistance at HK$168.20. That places the share price closer to the upper half of the corridor, but still below the ceiling that has capped recent advances. The 3-month high of HK$169.70 sits just above that resistance, which means the market is approaching a zone where earlier sellers have already shown up. As shown in the chart, this is a market that has room to move, but not much room for error if momentum weakens.
Oscillators & Momentum
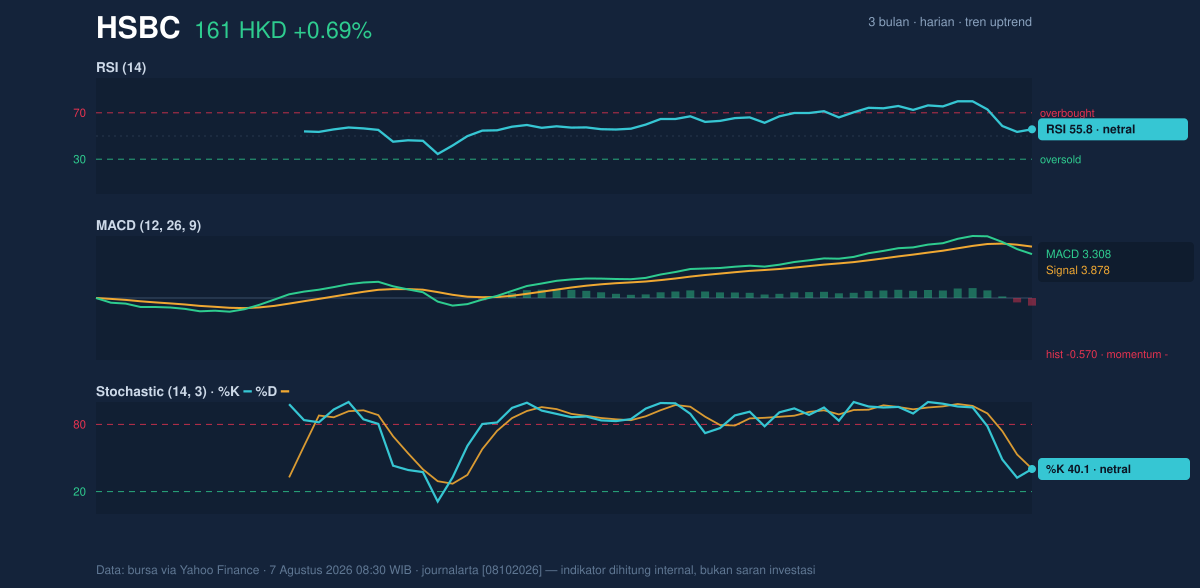
The momentum tools are mixed, and that is the real story behind the recent hesitation. RSI at 55.8 is neutral-to-positive, which means the stock is neither overstretched nor washed out. Stochastic %K at 40.1 and %D at 40.4 are also neutral, suggesting the latest pullback has cooled the near-term pace without pushing the stock into oversold territory. In other words, the chart has reset, but not enough to signal a strong reversal setup on its own.
The caution comes from MACD at 3.308 versus a signal line at 3.878, with a histogram of -0.570. That negative histogram means short-term momentum is lagging the longer trend. Traders often read this as a warning that price can still rise, but the engine underneath is not accelerating. It is a classic “trend intact, momentum soft” combination.
The chart’s oscillator panel shows exactly that split: neutral RSI and Stochastic, but a negative MACD histogram. That is not a bearish collapse signal, but it does say the market has not yet regained full thrust.
Volatility & Volume
Volatility is moderate rather than explosive. ATR(14) at 3.24, or about 2.0% of price, implies normal daily movement for a large-cap financial stock. The Bollinger Band width of 11.0% is also described as normal, so there is no squeeze suggesting a pending volatility burst, nor an expansion that would indicate a panic move is already underway. Price at %B 53% sits just above the middle band, which again points to balance rather than conviction.
Volume is the softer part of the picture. The latest turnover of 11,750,647 is only 0.8 times the 20-hour average of 15,402,222, and OBV is falling. That combination matters because a rise on lighter volume can be less reliable than one backed by broad participation. OBV — on-balance volume, a measure of whether volume is flowing into or out of the stock — is saying money flow has not yet confirmed the recent bounce. Price can hold up without strong volume for a while, but that usually leaves the move more vulnerable if sellers reappear near resistance.
So the tape is not broken, but it is not being strongly sponsored either.
Key Levels & Scenarios
The nearest technical map is straightforward. HK$168.20 is the first resistance to watch, and a move through that band would put the market back into the area of the 3-month high at HK$169.70. On the downside, HK$160.59 is the SMA20 and the Bollinger midline, making it an important pivot for near-term sentiment. Below that, HK$152.60 is the key support level, closely aligned with the broader SMA50 at HK$152.43. That overlap is meaningful: when support and a longer moving average sit in the same zone, the market often treats it as a stronger floor.
If HSBC can hold above HK$160.59, the chart keeps a constructive bias and can continue probing the HK$168.20 resistance. If it fails to hold the HK$160.59 area, attention shifts quickly to HK$152.60, where the trend would be tested more seriously. A break below that zone would weaken the current uptrend structure and hand control back to sellers.
Technical Verdict: HOLD (wait & see)
HOLD (wait & see) is the cleanest technical read because the stock is above its short- and medium-term averages, but momentum and participation are not fully confirming the trend.
- Reason 1: Price remains above the SMA20 and SMA50, which preserves the broader uptrend.
- Reason 2: RSI 55.8 and Stochastic 40.1/40.4 are neutral, showing no strong overbought or oversold extreme.
- Reason 3: MACD histogram -0.570, volume at 0.8x average, and falling OBV argue that momentum is not fully behind the move.
- Invalidation: the verdict weakens if price falls below HK$152.60.
- Ideal Entry Range: HK$160.59 to HK$152.60
- Exit Target: HK$168.20 to HK$169.70
- Stop Loss protection: below HK$152.60
Summary Data HSBC
| Last price | 161.20 HKD |
| Change 1 day / 5 days / 1 month | 0.69% / -4.16% / 5.02% |
| Trend / MA-cross | uptrend / none |
| SMA20 / SMA50 | 160.59 / 152.43 |
| RSI (14) / Stochastic %K | 55.8 / 40.1 |
| Bollinger %B / ATR | 53% / 3.24 |
| Support / Resistance 20 days | 152.60 / 168.20 |
| Data as of | 7 Agustus 2026 08:30 WIB |


