AIA Stock Technicals Today: Drops 1.18%, Testing Support Level
On September 24, 2026: price 75.35 HKD, trend sideways, RSI 46.9, support 74.65, resistance 77.50. technical analysis of aia stock. AIA Stock Technicals — full…

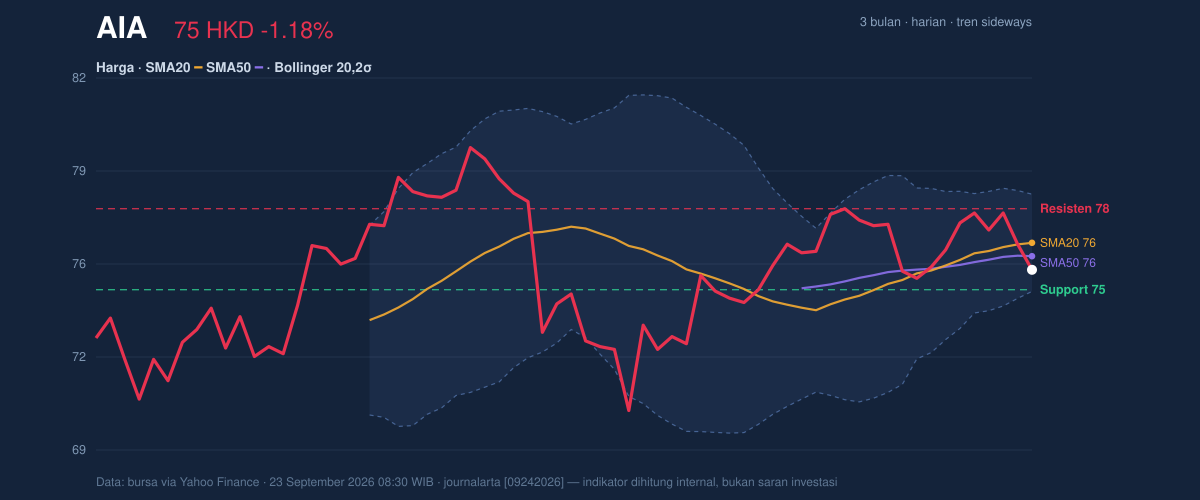
AIA Group slipped to HKD 75.35 in Hong Kong trading, down 1.18% from the previous close of 76.25, and the chart now shows a market stuck in a narrow, indecisive band rather than one with a clean trend. The stock is trading below its SMA20 at 76.30 but still above its SMA50 at 75.83, which matters because it places the shares between short-term weakness and a longer, still-intact base. With the 20-day Bollinger band squeezing to 4.5%, the move is also telling traders that volatility has compressed and a larger break could be forming, even if direction is not yet confirmed.
Trend & Price Action
The broader read is still sideways, and the slope of the SMA20 at 0.79% over 5 days suggests the short-term trend has not rolled over sharply, only lost momentum. That distinction matters. A stock drifting under the 20-day average while holding above the 50-day average often signals a market in consolidation, where participants are waiting for a catalyst rather than aggressively repricing the name.
As shown in the chart, AIA is sitting near the lower half of its recent range, with the last price at roughly 25% of the 20-day range. That positioning leans cautious. It means sellers have had the upper hand in the latest sessions, but not enough to force a decisive breakdown through the key floor at HKD 74.65. The stock is also still trading well inside the 3-month range of HKD 69.35 to HKD 80.15, which reinforces the idea that this is a range-bound phase rather than a trend reversal.
Oscillators & Momentum
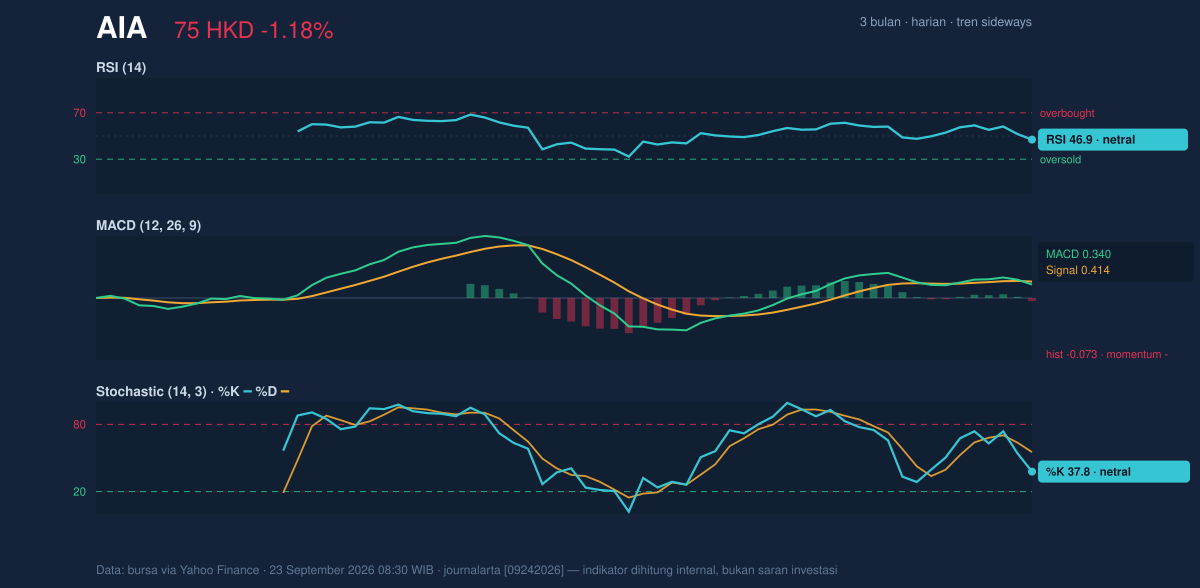
The momentum picture is softer than the price chart alone might suggest. RSI at 46.9 is neutral, which means the stock is neither stretched on the upside nor washed out on the downside. In plain terms, that leaves room for movement in either direction, but it also confirms that the latest decline has not yet reached an oversold extreme that often precedes a rebound.
The stochastic lines are also neutral, with %K at 37.8 below %D at 55.3. That setup usually implies short-term momentum is weaker than the recent average, but not yet in a panic phase. It is a subtle warning rather than a full sell signal. The more important detail is the MACD: MACD at 0.340 sits below its signal line at 0.414, with a histogram of -0.073. That negative histogram is the clearest sign here that upside momentum has faded. MACD is a trend-following tool, so when it slips below its signal line, it often means the market is losing lift even if the broader trend has not fully broken.
Volatility & Volume
The Bollinger setup is the most interesting part of the chart. Price is near the lower band, with %B at 22%, which means AIA is trading much closer to the lower edge of its 20-day volatility envelope than the upper edge. That does not automatically mean a bounce is imminent, but it does show the shares are leaning toward the weaker side of the band. More importantly, the band width has narrowed to 4.5%, a classic squeeze condition. Squeezes often precede expansion, so the market is signaling that the next move could be more forceful than the recent day-to-day drift.
Volume, however, has not yet confirmed a new trend. The latest volume of 22,857,528 is only 0.9x normal versus the 20-day average of 26,342,317, so participation is slightly below average rather than emphatically strong. That matters because breakouts built on thin volume are easier to fade. OBV, or on-balance volume, is also down, which suggests more shares have changed hands on down days than up days. In practical terms, the stock is not yet seeing convincing accumulation.
ATR at 1.60, or 2.1% of price, points to moderate daily movement. So while the Bollinger squeeze hints at a coming expansion, the current day-to-day range is still manageable, not chaotic.
Key Levels & Scenarios
The market is now clustered around the first important floor at HKD 74.65. If that level holds, it keeps the stock inside the current range and leaves room for a stabilisation attempt back toward the middle band at HKD 76.30. That midpoint matters because it is both the Bollinger median and the SMA20, so it acts as a technical pivot where short-term sentiment can shift.
Above that, the near-term ceiling is HKD 77.50. A move through that level would suggest buyers have regained enough control to challenge the upper Bollinger band at HKD 78.01. If the stock cannot reclaim the 20-day average, the chart remains vulnerable to further softening toward the lower band. The current structure is therefore less about one big directional call and more about whether the stock can defend the lower end of the squeeze without losing the 50-day average.
Technical Verdict: HOLD (wait & see)
HOLD (wait & see) is the cleanest technical verdict because the chart is caught between a soft short-term trend and a still-valid medium-term base.
- Reason 1: Price is below the SMA20 but above the SMA50, which signals consolidation rather than a confirmed trend break.
- Reason 2: MACD is negative and OBV is down, so momentum and participation are not yet supporting a fresh advance.
- Reason 3: Bollinger bands are squeezing, which raises the odds of a move, but the direction is still unconfirmed.
- Verdict invalidated if price breaks below HKD 74.65, because that would put the stock under the nearest support and weaken the current range structure.
- Ideal entry range: HKD 74.65 to HKD 76.30
- Exit target: HKD 77.50 to HKD 78.01
- Stop loss protection: below HKD 74.59 on a closing basis
For non-traders, that means AIA is not showing enough strength to call a clean recovery yet, but it has also not lost the technical floor that would confirm a deeper slide.
Summary Data AIA
| Last price | 75.35 HKD |
| Change 1 day / 5 days / 1 month | -1.18% / -2.14% / 1.55% |
| Trend / MA-cross | sideways / none |
| SMA20 / SMA50 | 76.30 / 75.83 |
| RSI (14) / Stochastic %K | 46.9 / 37.8 |
| Bollinger %B / ATR | 22% / 1.60 |
| Support / Resistance 20 days | 74.65 / 77.50 |
| Data as of | 23 September 2026 08:30 WIB |


