Testing Support Level, HSBC Stock Gains 0.13% Today
On September 24, 2026: price 159.50 HKD, trend sideways, RSI 44.0, support 159.30, resistance 167.60. technical analysis of hsbc stock.

At HK$159.50, HSBC Holdings is trading just above its previous close but still below the 20-day and 50-day moving averages, a setup that says the stock has not yet regained trend control even after a small daily bounce. The broader picture is more cautious than the headline move suggests: the shares are down 0.87% over 5 days and 1.36% over 1 month, while the chart remains sideways with the SMA20 sloping down 0.24% over 5 days. That combination points to a market that is stabilizing, but not yet convincing enough to call a clean recovery. The price is also sitting near the lower end of the recent range, which matters because it tells you where buyers are willing to step in — and where they are still hesitant.
Trend & Price Action
The most important signal on the price chart is that HSBC is below the SMA20 at HK$162.56 and the SMA50 at HK$162.14, with no fresh MA cross to confirm a new trend. In plain language, the stock is still trading under the short- and medium-term averages that many market participants use as a rough line between strength and weakness. When price stays below both, rallies often face overhead supply as traders who bought higher look to exit near breakeven.
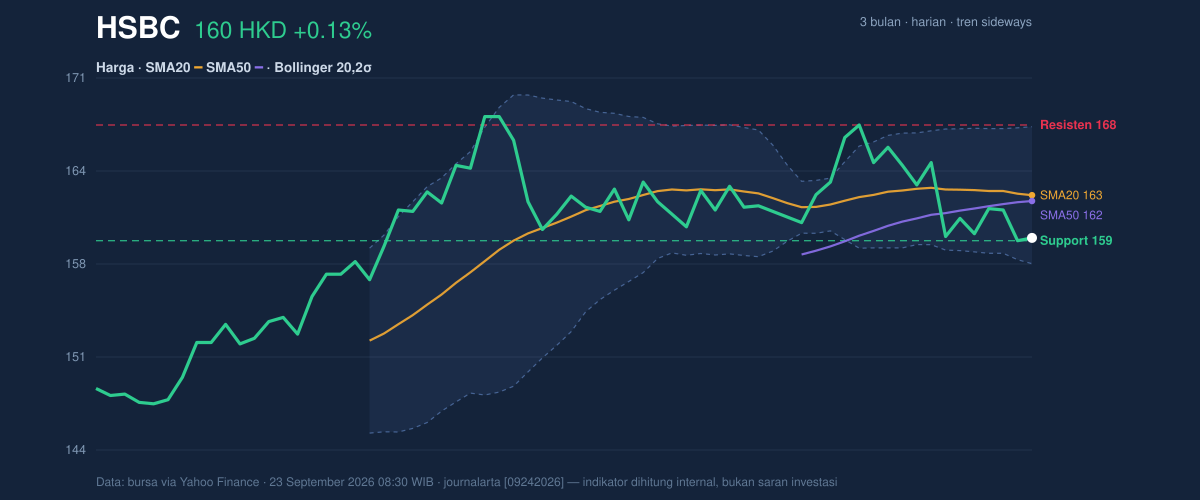
The stock is also trading near support at HK$159.30, only slightly below the last price, while resistance sits at HK$167.60. That means the market is compressed inside a relatively narrow band, with the current price positioned in the lower part of the 3-month range between HK$145.40 and HK$169.70. The signal here is not just “range-bound”; it is that the market is testing whether recent support can absorb selling pressure before any meaningful attempt to reclaim the moving averages.
A short bounce is possible. A trend reversal is not yet confirmed.
Oscillators & Momentum
The momentum tools are mixed, and that mix is the real story. RSI at 44.0 is neutral, which means the stock is neither stretched to the upside nor deeply oversold on a broad basis. But the Stochastic reading of %K 16.8 and %D 19.6 is oversold, showing the short-term price has been weak enough to press into a zone where rebound attempts can emerge. That does not guarantee a reversal; it only tells us the decline has become mature enough for traders to watch for a bounce.
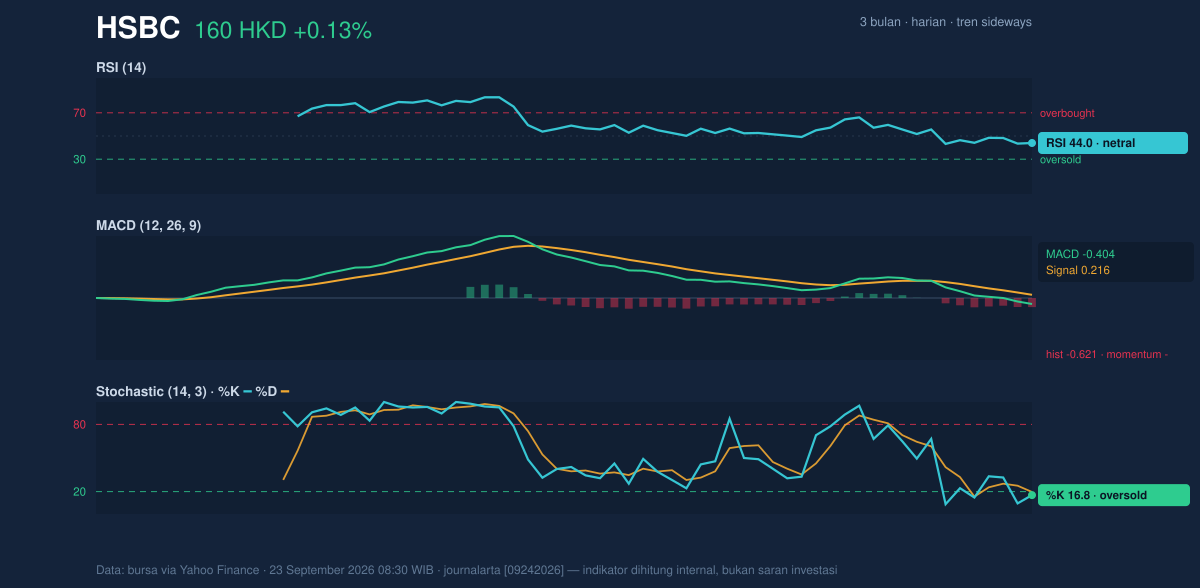
The problem is that momentum confirmation is missing. MACD is -0.404, below the signal line at 0.216, with a histogram of -0.621. That is a clear negative read: the downward move still has more force than the recovery attempt. In practical terms, the oversold stochastic is saying “the stock is stretched,” while MACD is saying “the downtrend is still in charge.” When those two disagree, price often needs a catalyst — or a decisive break above nearby resistance — before the market commits to direction.
Volatility & Volume
Volatility is moderate, but the structure of volatility is more important than the raw number. ATR at 2.76, or about 1.7% of price, suggests the stock can move without being chaotic, while the Bollinger Band width of 6.0% is narrowing. A squeeze like this often means the market is coiling, not sleeping. Narrow bands can precede a stronger move because price has less room to drift; it eventually has to choose a direction.
The key clue is where price sits within that band. %B at 19% places HSBC close to the lower Bollinger Band at HK$157.65, showing the stock is leaning into the lower end of its recent volatility envelope. That is consistent with weakness, but it also means the downside is already somewhat extended relative to the recent range. If the lower band gives way, the market may be signaling that sellers still have control. If it holds, the squeeze could help a rebound toward the middle band at HK$162.56.
Volume does not yet provide a strong confirmation signal. The latest volume of 10,286,032 is only about 1.0x normal versus the 20-day average of 10,224,747, so the move is not being driven by a surge in participation. More telling is that OBV is falling, which implies that trading flow has been net negative even if the day-to-day volume looks ordinary. In other words, the market is not seeing the kind of accumulation that usually accompanies a convincing base.
Key Levels & Scenarios
The immediate map is straightforward. HK$159.30 is the nearest support and the current line in the sand. A hold above that area keeps the stock inside the range and preserves the possibility of a bounce back toward HK$162.56, where both the SMA20 and Bollinger mid-band sit. Beyond that, HK$167.60 is the next resistance to watch, and it aligns closely with the upper Bollinger Band at HK$167.47. That makes the upper zone a meaningful test: it is where short-term strength would need to prove itself.
If price fails to hold HK$159.30, the chart would likely shift from “range-bound weakness” to “range break risk,” opening the door to a move toward the lower Bollinger Band at HK$157.65 and then potentially deeper into the 3-month range.
Technical Verdict: HOLD (wait & see)
HOLD (wait & see)
- MACD remains negative, showing downside momentum is still dominant.
- Price is below SMA20 and SMA50, so the stock has not reclaimed trend support.
- Stochastic is oversold and Bollinger Bands are squeezing, which argues for patience rather than chasing weakness.
Verdict invalidated if price breaks HK$159.30 on a sustained basis.
- Ideal Entry Range: HK$157.65 to HK$159.30
- Exit Target: HK$162.56, then HK$167.47 to HK$167.60
- Stop Loss protection: below HK$157.65
For non-traders: the chart says HSBC is close to support, but it has not yet shown enough strength to prove that the recent weakness is over.
Summary Data HSBC
| Last price | 159.50 HKD |
| Change 1 day / 5 days / 1 month | 0.13% / -0.87% / -1.36% |
| Trend / MA-cross | sideways / none |
| SMA20 / SMA50 | 162.56 / 162.14 |
| RSI (14) / Stochastic %K | 44.0 / 16.8 |
| Bollinger %B / ATR | 19% / 2.76 |
| Support / Resistance 20 days | 159.30 / 167.60 |
| Data as of | 23 September 2026 08:30 WIB |


