DBS Stock Drops 0.14%, Testing Key Resistance In Focus
On September 24, 2026: price 77.69 SGD, trend uptrend, RSI 58.2, support 75.65, resistance 78.65. technical analysis of dbs stock. DBS Stock Drops — full…

DBS Group’s shares were last at SGD 77.69, down 0.14% from the previous close, but still sitting above both its short- and medium-term trend lines, with the stock trading above the SMA20 at 77.30 and well clear of the SMA50 at 75.76. That matters because price holding above these averages usually signals that recent buyers are still in control, even if the latest session was slightly softer. The broader picture remains constructive: the stock is in an uptrend, the SMA20 is rising at 0.43% over 5 days, and the shares are positioned in the upper part of the recent range, about 68% of the way from support to resistance.
The signal, though, is not purely one-way. The chart shows a market that is advancing, but not with strong conviction.
Trend & Price Action
As shown in the chart, DBS is trading between support at 75.65 and resistance at 78.65, with the last price closer to the upper end of that band than the lower. That placement suggests the market is still willing to pay up for the shares, but it has not yet broken into a fresh leg higher. The stock also remains below the 3-month high of 79.05, which gives the current move a clear ceiling: traders are watching whether DBS can absorb supply near the upper 78s and push through the recent peak.
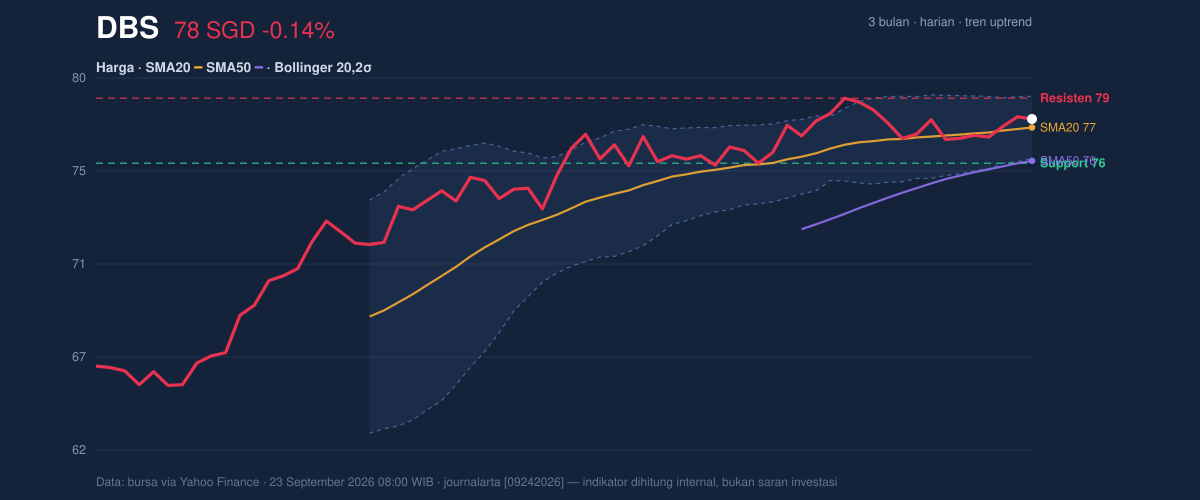
The absence of a fresh MA-cross is important in a different way. It means the current uptrend is being carried more by price staying above the averages than by a new moving-average crossover event. In plain English, the trend is intact, but it has not been re-energized by a fresh technical trigger. That often leaves a stock vulnerable to pauses or short pullbacks if momentum weakens.
Oscillators & Momentum
The momentum picture is mixed, and that is where the story becomes more nuanced. The RSI at 58.2 is neutral-to-firm, which says the stock is neither overbought nor oversold. That is generally a healthy reading in an uptrend: it suggests the move has room to continue without looking stretched. The Stochastic at 50.4 / 47.7 is also neutral, reinforcing the idea that DBS is not in an extreme condition. But the MACD at 0.531 sits below its signal at 0.662, with a histogram of -0.131, which points to negative momentum underneath the broader uptrend.
That combination matters. It tells readers the stock is still trending up, but the rate of ascent has slowed. In technical terms, the trend is positive while the push behind it is fading. That often shows up when a share is consolidating near resistance, exactly the kind of setup DBS appears to be in now.
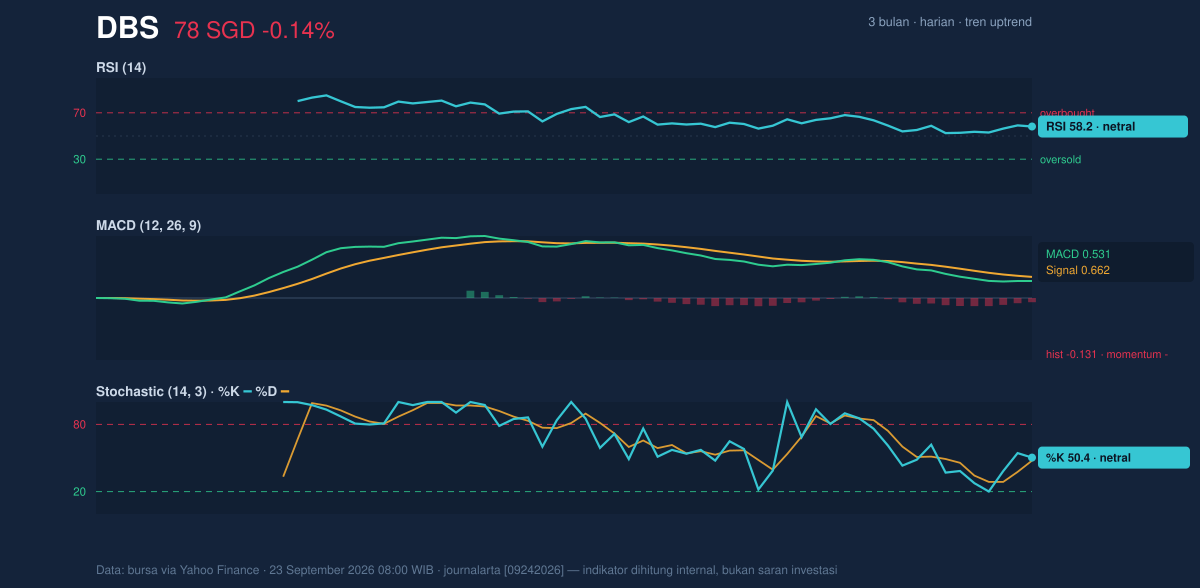
The chart also helps explain why the market may be waiting for fresh direction: oscillators are not flashing a breakout, but neither are they warning of a sharp reversal. It is a holding pattern, with momentum leaning a touch softer than price action.
Volatility & Volume
Volatility is subdued. The ATR at 0.87, or about 1.1% of price, suggests relatively quiet trading conditions. That usually means the stock is not being driven by panic or euphoria, and it can also hint that a larger move may be building once the current range resolves. Bollinger Bands tell a similar story: the band width is only 3.7% and is narrowing, a classic squeeze pattern that often precedes a breakout. The last price sits at a %B of 63%, which places it above the middle band but not near the top rail. In practical terms, DBS is leaning bullish without looking overheated.
Volume adds a subtle confirmation. The latest turnover of 3,915,100 was about 1.1× the 20-hour average, while OBV is rising. Rising On-Balance Volume means the market is seeing net accumulation: more volume is accompanying upward moves than downward ones. That is a useful counterweight to the softer MACD reading, because it suggests participation is still there even if momentum has cooled.
The market is quiet, but not asleep.
Key Levels & Scenarios
For the next move, the key battleground is straightforward. A sustained push through 78.65 resistance would put the 79.05 three-month high back in view and would likely be read as confirmation that the squeeze is resolving to the upside. If DBS fails to hold above the 77.30 SMA20, the chart would lose some of its near-term support structure and could drift back toward 75.65 support. That lower band is especially important because it marks the recent floor of the trading range.
The current setup is therefore less about chasing a trend and more about watching whether the stock can convert a narrow range into a fresh breakout. The ingredients are mixed: trend is positive, volume is supportive, but momentum is not fully aligned.
Technical Verdict: HOLD (wait & see)
HOLD (wait & see)
- Trend support is intact: price is above the SMA20 at 77.30 and SMA50 at 75.76, which keeps the broader structure constructive.
- Momentum is mixed: RSI 58.2 and Stochastic 50.4 / 47.7 are neutral, but MACD 0.531 below signal 0.662 shows weakening internal momentum.
- Volatility is compressed: Bollinger width 3.7% and ATR 0.87 suggest a move may be brewing, but direction is not yet confirmed.
- Verdict invalidated if price falls below 75.65, where recent support and the lower edge of the range give way.
- Ideal entry range: 77.30 to 75.86
- Exit target: 78.65 to 79.05
- Stop loss protection: below 75.65
In plain English: DBS still looks technically healthy, but the chart is waiting for a cleaner signal before the next decisive move.
“The market is not rejecting DBS — it is simply asking for proof.”
Summary Data DBS
| Last price | 77.69 SGD |
| Change 1 day / 5 days / 1 month | -0.14% / 1.16% / 1.90% |
| Trend / MA-cross | uptrend / none |
| SMA20 / SMA50 | 77.30 / 75.76 |
| RSI (14) / Stochastic %K | 58.2 / 50.4 |
| Bollinger %B / ATR | 63% / 0.87 |
| Support / Resistance 20 days | 75.65 / 78.65 |
| Data as of | 23 September 2026 08:00 WIB |


