Tencent Momentum Gains: Stock Drops 2.35% (September 24, 2026)
On September 24, 2026: price 441.00 HKD, trend sideways, RSI 50.8, support 419.00, resistance 455.20. technical analysis of tencent stock.

Tencent Holdings slipped on the Hong Kong exchange on 23 September 2026, with 0700.HK last changing hands at 441.00 HKD after a 2.35% one-day drop, even as the stock stayed above its short-term trend line and volume ran slightly above normal, according to data from Yahoo Finance via the exchange. The move leaves the shares in a technically mixed position: not weak enough to signal outright breakdown, but not strong enough to suggest a clean breakout either.
Trend & Price Action
The first thing the chart shows is that Tencent is still trading above its SMA20 at 437.18 but below its SMA50 at 451.20, a classic sign of a market that is losing medium-term momentum while still holding its nearest support. In plain language, the stock is sitting in the gap between near-term stabilization and longer-term hesitation. The trend is described as sideways, and the SMA20 slope of -0.77% over 5 days suggests that even the short-term base is leaning lower rather than building upward pressure.
That matters because sideways markets often disguise a tug-of-war: buyers are defending dips, but sellers are still strong enough to cap rallies. Tencent’s price is at 61% of the 20-hour range, which means it is closer to the upper half of that band, but not pressing hard enough against resistance to imply a breakout attempt is underway.
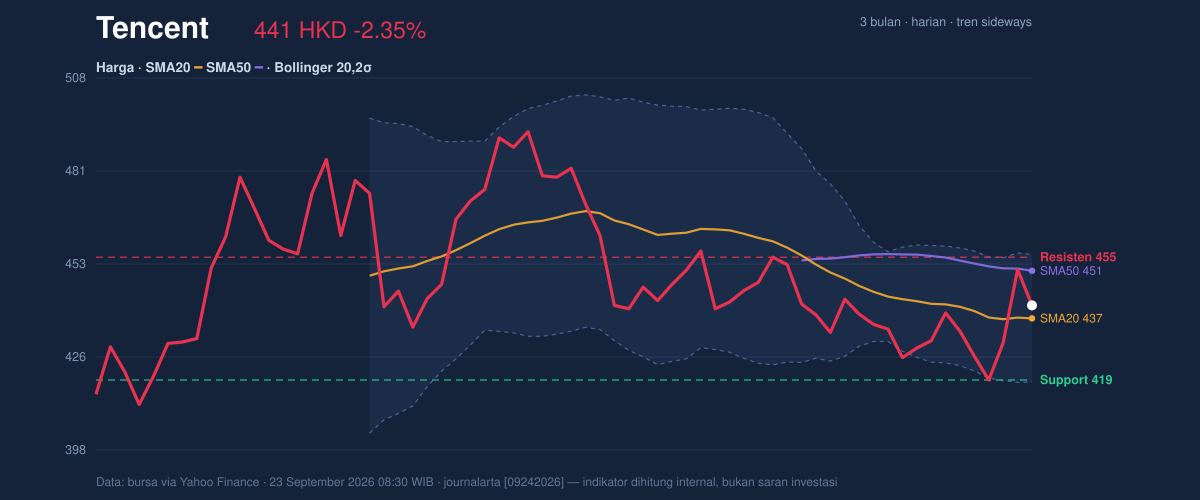
The stock is also well below its 3-month high of 497.80 and above its 3-month low of 411.00, reinforcing the idea that the shares are still trapped inside a broad range rather than trending decisively in either direction.
Oscillators & Momentum
The momentum picture is more constructive than the price action alone would suggest. RSI at 50.8 is almost perfectly neutral, which means Tencent is neither overbought nor oversold. That is important: the market has not stretched itself far enough to force a reversal, but it also has not built the kind of strong momentum that usually accompanies a sustained advance.
The Stochastic %K at 49.5 and %D at 53.8 also sit in neutral territory, showing no immediate sign of an exhaustion top or a deep washout. In practical terms, the oscillator pair is telling investors that the stock is paused, not panicking.
The more interesting signal comes from MACD. Tencent’s MACD at -3.787 remains below zero, which means the broader momentum backdrop is still technically negative, but the histogram at 1.615 is positive and the signal line at -5.402 sits below the MACD line. That combination usually means downside momentum is fading and a rebound attempt is forming, even if the trend has not yet fully turned. As shown in the chart, the momentum gauges are improving before price has fully confirmed it.
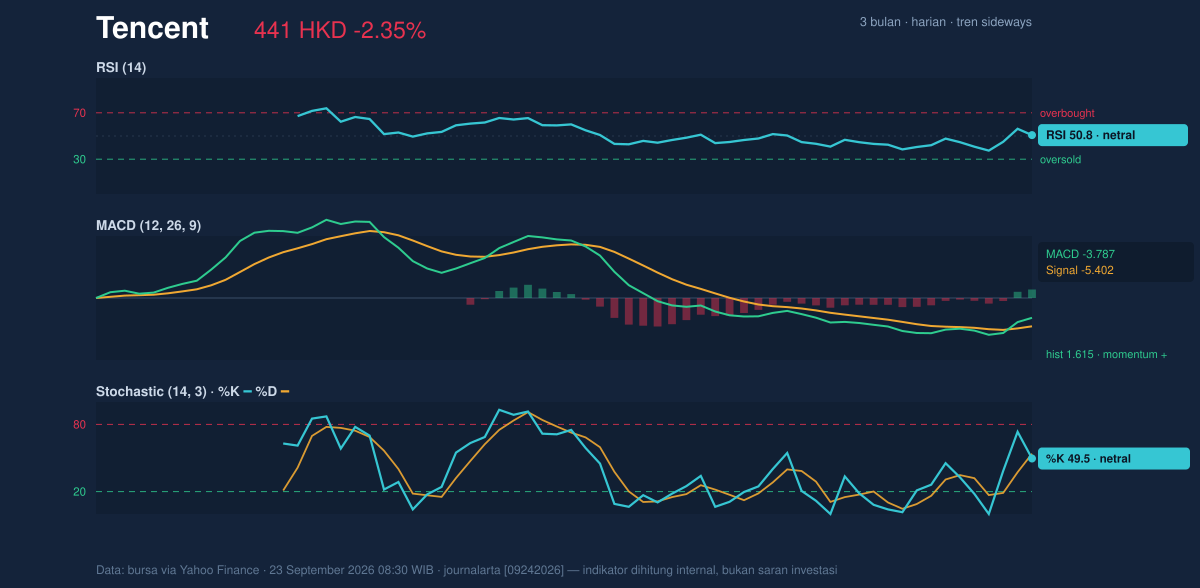
So the message is not “strong trend,” but “pressure easing.” That distinction matters.
Volatility & Volume
Tencent’s Bollinger Bands are relatively calm, with a band width of 8.6%, which the data classifies as normal. This is not the sort of compressed setup that usually precedes a violent move, nor is it an expanded, high-stress phase where traders are chasing extremes. The %B reading of 60% places price in the upper half of the band, leaning mildly constructive without being stretched toward the upper boundary at 456.00.
That combination — mid-range momentum, normal volatility, and price above the middle band at 437.18 — suggests Tencent is in a consolidation phase with room to move either way, but without a strong volatility trigger yet.
Volume adds a modestly supportive note. Last volume was 22,309,793, or 1.1× normal versus the 20-hour average of 21,120,571. That is not heavy conviction, but it does show the selloff was not happening on thin participation. More importantly, OBV is rising, which means cumulative volume flow is still tilting toward accumulation rather than distribution. In simple terms, the market is not abandoning the stock even as price softens.
Key Levels & Scenarios
The immediate map is fairly clear. On the downside, support at 419.00 is the level to watch first; it sits close to the 3-month low of 411.00 and would likely matter if the stock loses its short-term footing. On the upside, resistance at 455.20 aligns closely with the SMA50 at 451.20 and the upper Bollinger band at 456.00, creating a tight overhead barrier where sellers have several reasons to reappear.
If Tencent remains above 437.18, the chart can keep building a base. If it pushes through 455.20, that would be the first meaningful sign that the stock is trying to reclaim its medium-term trend. If it fails to hold 419.00, the market would be signaling that the sideways structure has broken down and that the lower end of the 3-month range is back in play.
Technical Verdict: HOLD (wait & see)
HOLD (wait & see)
- RSI at 50.8 and Stochastic at 49.5/53.8 are neutral, so momentum is not yet decisive.
- MACD is still negative at -3.787, but the positive histogram at 1.615 shows improvement and reduces immediate downside urgency.
- Price above SMA20 at 437.18 and OBV rising suggest the base is not broken, but price below SMA50 at 451.20 keeps the medium-term ceiling intact.
Verdict invalidated if price falls below 419.00.
- Ideal Entry Range: 419.00 to 437.18
- Exit Target: 451.20 to 455.20
- Stop Loss: below 419.00
For non-traders: Tencent is holding its footing, but it still needs to prove that the recent weakness is only a pause, not the start of a deeper slide.
“The market is not rejecting Tencent, but it is not rewarding it either — and that hesitation is exactly where the risk sits.”
Summary Data Tencent
| Last price | 441.00 HKD |
| Change 1 day / 5 days / 1 month | -2.35% / 1.75% / -0.99% |
| Trend / MA-cross | sideways / none |
| SMA20 / SMA50 | 437.18 / 451.20 |
| RSI (14) / Stochastic %K | 50.8 / 49.5 |
| Bollinger %B / ATR | 60% / 12.19 |
| Support / Resistance 20 days | 419.00 / 455.20 |
| Data as of | 23 September 2026 08:30 WIB |


