AIA Stock Gains 1.85%, Golden Cross Formed In Focus
On Agustus 11, 2026: price 74.50 HKD, trend sideways, RSI 41.2, support 72.40, resistance 79.65. technical analysis of aia stock. AIA Stock Gains — full…

AIA Group fell to 74.50 HKD on HKEX in the latest session, up 1.85% from the previous close of 73.15, but still trading below its short-term trend line. The move matters less as a one-day rebound than as a test of whether the stock can hold above the lower end of its recent range. As shown in the chart, the price sits under SMA20 at 76.76 and SMA50 at 75.56, even though the moving averages have already produced a golden cross, a pattern that usually signals improving trend structure. In plain English, the trend is trying to turn up, but the market has not yet fully accepted that message.
Trend & Price Action
The broader setup is still best described as sideways, with the SMA20 slope at 1.08% over 5 days showing only a modest upward tilt. That is important because a rising moving average can hint at improving sentiment, but it does not override the fact that the share price is still below SMA20. The stock is also trading at 29% of its 20-day range, which places it closer to support than resistance and suggests the market is not yet willing to price in a full breakout. The 3-month high of 89.00 and 3-month low of 69.05 frame the current move as a recovery attempt inside a wider band, not a trend reversal that has already been confirmed.
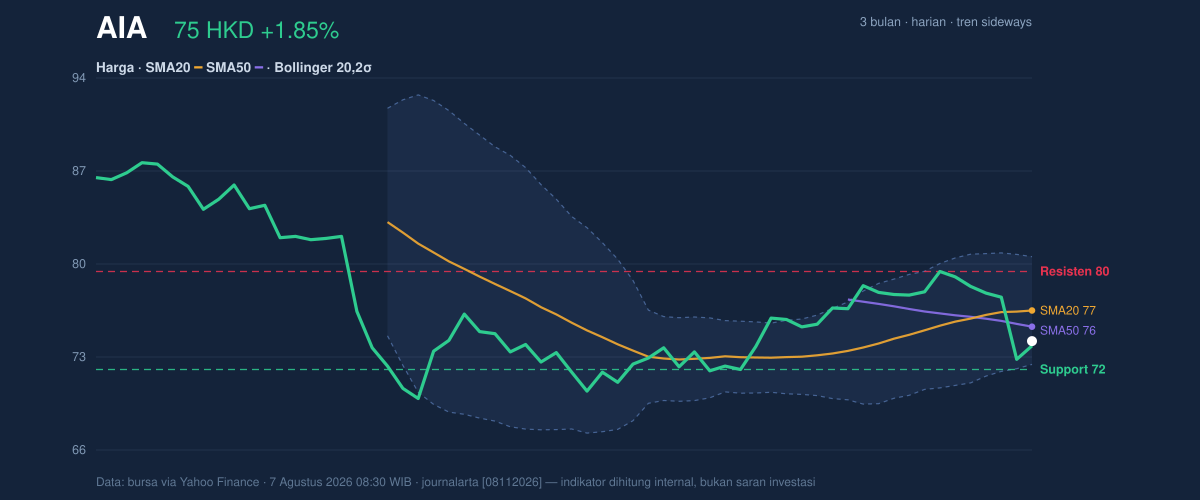
The chart shows a market that is trying to stabilize, but not convincingly enough to reclaim lost ground. The fact that the price is below both short-term averages while the averages themselves have crossed higher is a classic “mixed signal” setup: trend mechanics have improved, yet price action has not followed through. That gap often means traders are waiting for a stronger close above overhead levels before committing more capital.
Oscillators & Momentum
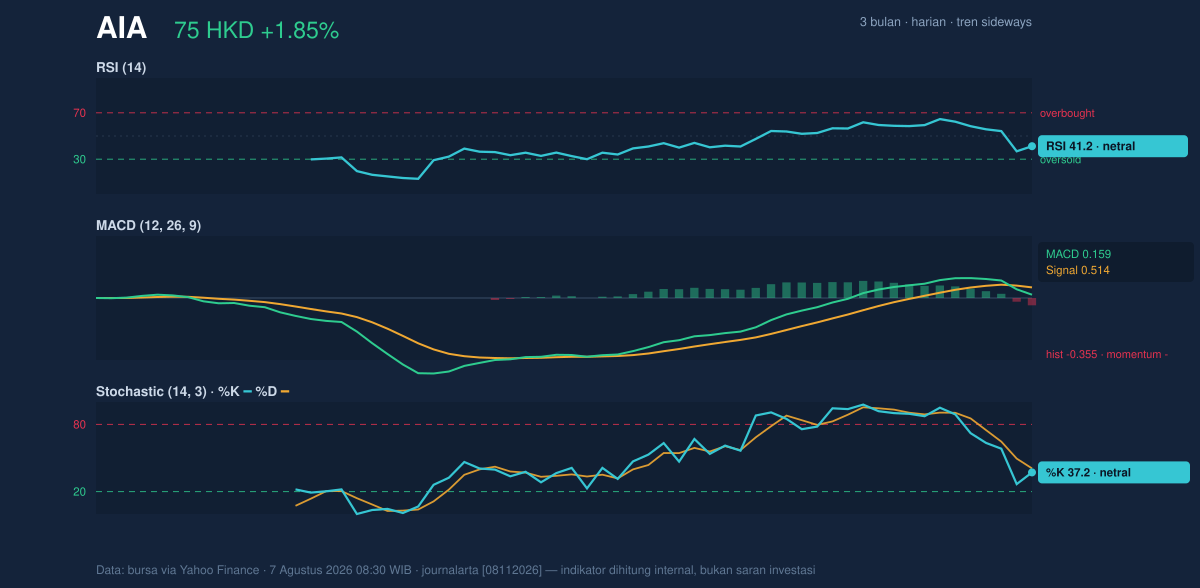
Momentum indicators are leaning cautious. RSI(14) at 41.2 is neutral, which means the stock is neither stretched nor washed out. That matters because there is no strong oversold signal to force a rebound, but also no overbought condition that would argue for immediate exhaustion. The Stochastic %K at 37.2 and %D at 40.7 are also neutral, reinforcing the idea that momentum is still searching for direction rather than confirming a breakout.
The more telling indicator is MACD at 0.159 versus signal at 0.514, with a histogram of -0.355. That negative histogram means the faster trend line is still below the slower signal line, a sign that downside momentum has not fully cleared. For readers less familiar with the term, MACD is a gauge of whether recent price movement is gaining or losing strength; here, it says the rebound has not yet earned conviction. In other words, the technical structure is improving faster than the momentum behind it.
Volatility & Volume
Volatility is present, but not extreme. ATR(14) at 2.16, equal to 2.9% of price, points to a market that can still move meaningfully in either direction without entering panic mode. The Bollinger Bands help explain the current positioning: the upper band is 80.75, the middle band is 76.76, and the lower band is 72.77. With %B at 22%, the share price is sitting in the lower portion of the band structure, which usually indicates weakness or a market that has not yet regained the middle of its trading envelope. The 10.4% band width is normal, not squeezed, so there is no obvious signal that a major expansion move is imminent.
Volume gives the rebound some credibility, but only partially. The latest turnover of 45,446,231 was about 1.7× the 20-day average of 26,356,124, which shows participation was stronger than usual. That is constructive because price moves backed by heavier volume are more likely to be noticed by the market. Yet OBV is down, and that matters because On-Balance Volume tracks whether volume is accumulating on up days or draining away over time. A falling OBV suggests the broader flow of capital has not fully turned in favor of the stock, so the latest burst of activity looks more like a test than a confirmed accumulation phase.
Key Levels & Scenarios
The immediate technical map is clear. Support at 72.40 is the first level that matters, while resistance at 79.65 is the nearest ceiling. The Bollinger lower band at 72.77 sits just above support, which makes the low-72 area especially important: if that zone gives way, the chart loses its nearest buffer. On the upside, a move back through SMA20 at 76.76 and then toward 79.65 would show that the stock is not just bouncing, but actually reclaiming the middle of its recent range. Until then, the price remains pinned below the band midpoint and below both moving averages, which keeps the burden of proof on the bulls.
Technical Verdict: HOLD (wait & see)
HOLD (wait & see) because the chart is showing early repair, but not enough confirmation to call the move complete.
- Golden cross between SMA20 and SMA50 is constructive, but price is still below SMA20 at 76.76.
- MACD histogram is negative, which says momentum remains weaker than the trend signal.
- Volume is 1.7× average, but OBV is down, so participation has not fully confirmed accumulation.
- Invalidation condition: the verdict weakens if price falls below 72.40, because that would break the nearest support and sit below the Bollinger lower band at 72.77.
- Ideal Entry Range: 72.77 to 76.76
- Exit Target: 79.65
- Stop Loss protection: 72.40
For non-traders, this means the stock is trying to improve, but it still needs proof before the chart can be read as healthy again.
The latest 3-month low remains 69.05.
Summary Data AIA
| Last price | 74.50 HKD |
| Change 1 day / 5 days / 1 month | 1.85% / -5.99% / 2.55% |
| Trend / MA-cross | sideways / golden |
| SMA20 / SMA50 | 76.76 / 75.56 |
| RSI (14) / Stochastic %K | 41.2 / 37.2 |
| Bollinger %B / ATR | 22% / 2.16 |
| Support / Resistance 20 days | 72.40 / 79.65 |
| Data as of | 7 Agustus 2026 08:30 WIB |



