Alibaba Stock Gains 1.85% Today, Golden Cross Formed
On Agustus 11, 2026: price 126.70 HKD, trend uptrend, RSI 61.7, support 110.00, resistance 128.10. technical analysis of alibaba stock.

Alibaba Group’s shares on HKEX rose to HKD 126.70 on Thursday, extending a short-term rebound that has pushed the stock to 92% of its 20-hour range and to within striking distance of HKD 128.10 resistance, according to exchange data cited via Yahoo Finance. The move matters because it is not just a one-day bounce: the stock is up 8.29% over five days and 14.97% over one month, while the chart structure has turned constructive with a golden cross already in place.
That combination tells a simple story. The market is paying up for momentum, but it is also testing whether the rally has enough participation to keep going after a fast run.
Trend & Price Action
Alibaba is trading above both its SMA20 at HKD 116.47 and SMA50 at HKD 111.42, which means the current price is sitting on the stronger side of the intermediate trend rather than merely recovering from a dip. The SMA20 has a 4.95% five-day slope, a useful signal that the short-term trend is still rising rather than flattening out. More importantly, the golden cross — where the 20-day average moves above the 50-day average — usually marks a shift in market control from sellers to buyers, or at least from hesitation to accumulation.
The price is now pressing near the top of the visible band structure, with Bollinger resistance at HKD 127.77 and the 20-hour resistance level at HKD 128.10, as shown in the chart. That matters because rallies often pause where short-term momentum meets overhead supply: traders who bought earlier may take profits there, while new buyers want proof the stock can absorb it.
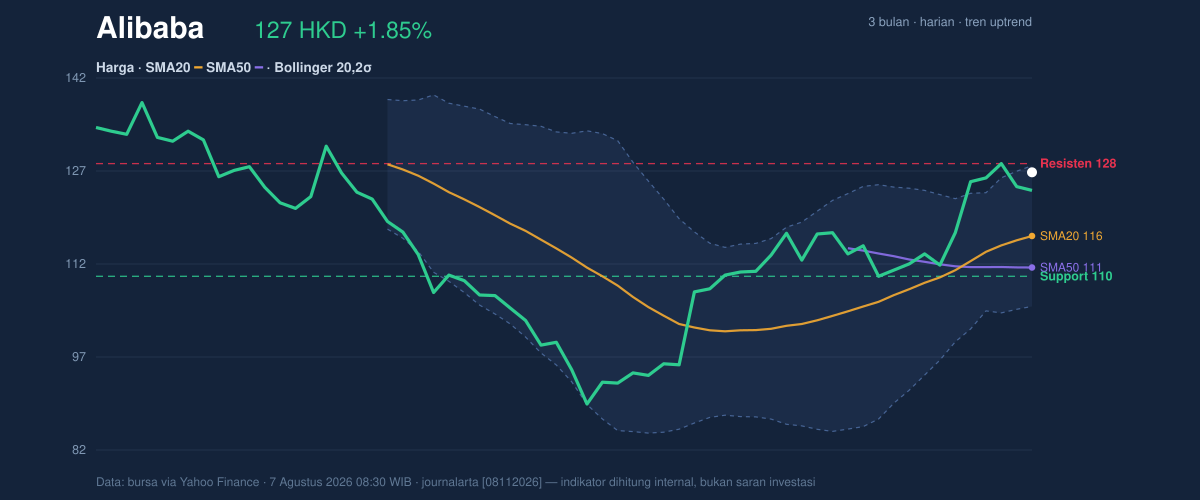
The stock is also still below its 3-month high of HKD 144.00, which leaves room for the broader recovery to continue if the current breakout attempt holds. But it is far above the 3-month low of HKD 88.65, showing that the market has already priced in a meaningful reversal from the prior weakness.
Oscillators & Momentum
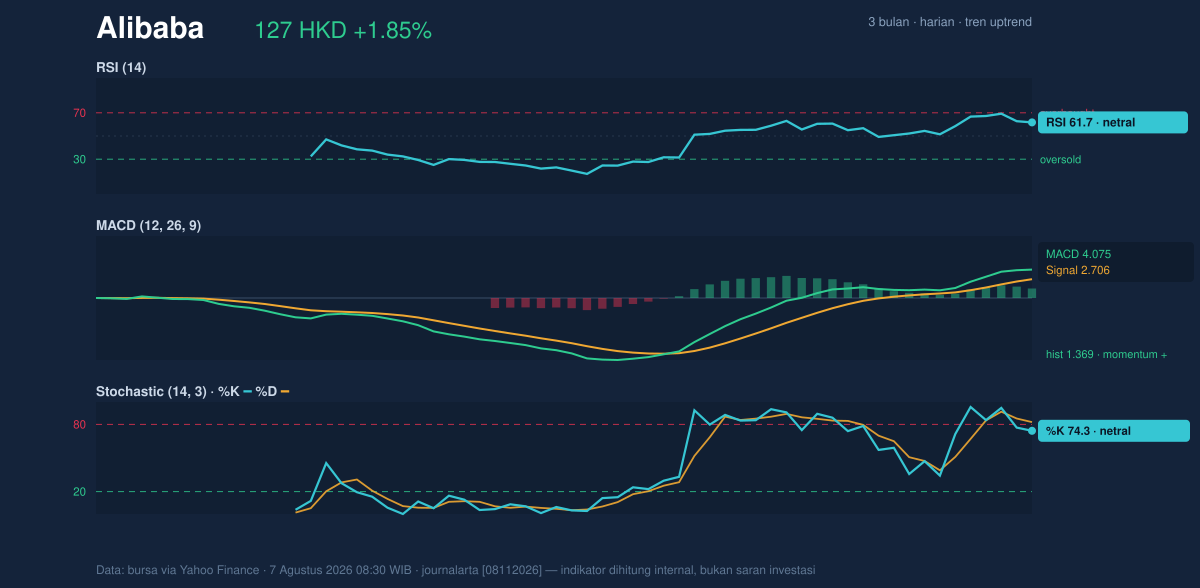
The momentum picture is supportive, but not euphoric. RSI at 61.7 is in neutral territory with an upward tilt: that usually means the stock has strength, but it is not yet in the kind of overheated zone that often triggers an immediate pullback. The Stochastic %K at 74.3 and %D at 82.1 are closer to the upper end of the range, which signals the move is already well advanced in the short term. In plain language, the stock has been running hot enough to attract attention, but not so hot that momentum has clearly rolled over.
The MACD at 4.075 remains above its signal line at 2.706, with a positive histogram of 1.369. That is the cleanest confirmation in the data set: MACD is not only positive, it is still expanding above the signal line, which usually means trend momentum is being reinforced rather than fading. The key nuance is that oscillators are not all at the same stage. RSI is still moderate, Stochastic is nearer the top, and MACD is bullish — a mix that often appears when a trend is healthy but approaching a short-term decision point.
Volatility & Volume
Volatility is elevated. The ATR(14) at 4.89, or 3.9% of price, indicates the stock can move meaningfully in a single session. That is important because when price is near resistance, a high ATR can produce either a clean breakout or a sharp rejection; the range is wide enough for both outcomes. Bollinger Bands are still in a normal 19.4% width state, so this is not a squeeze setup where a large expansion is being forced. Instead, the stock is already moving within a fairly active but orderly range, with %B at 95% showing price is trading near the upper band. That usually means the market is leaning bullish, but also that it is no longer cheap on a short-term basis.
Volume adds a caution flag. The latest turnover of 58,259,425 is only 0.6x the 20-hour average of 104,020,754, so the rally is happening on lighter-than-normal participation. That does not negate the move, but it does weaken the quality of the breakout attempt: strong advances are easier to trust when volume expands, not contracts. The one encouraging counterweight is that OBV is rising, which suggests cumulative buying pressure has been building even if the latest session was quiet.
Key Levels & Scenarios
The immediate technical battleground is straightforward. Support sits at HKD 110.00, and that level matters because it is also below the rising averages, making it the first area where trend damage would begin to show. On the upside, HKD 128.10 is the nearest resistance, closely aligned with the HKD 127.77 Bollinger upper band. A sustained move through that zone would indicate the stock is no longer just testing the top of its recent range but attempting to extend beyond it.
If price breaks above HKD 128.10, the chart would be signaling that the current uptrend has enough force to challenge higher levels within the broader 3-month range. If it fails to hold HKD 110.00, the technical picture would weaken materially because the stock would lose the short-term trend support that has been guiding the rebound.
Technical Verdict: HOLD (wait & see)
HOLD (wait & see)
- MACD remains positive and above its signal line, which supports the uptrend.
- Price is above SMA20 and SMA50 with a golden cross, confirming bullish structure.
- %B at 95% and price near HKD 128.10 resistance suggest the move is extended in the short term, while volume is only 0.6x average.
Verdict invalidated if price falls below HKD 110.00.
- Ideal Entry Range: HKD 116.47 to HKD 110.00
- Exit Target: HKD 127.77 to HKD 128.10
- Stop Loss protection: below HKD 110.00
For non-traders, this means the stock is technically stronger than it was a few weeks ago, but it is now trading right under a ceiling where momentum needs fresh confirmation.
Summary Data Alibaba
| Last price | 126.70 HKD |
| Change 1 day / 5 days / 1 month | 1.85% / 8.29% / 14.97% |
| Trend / MA-cross | uptrend / golden |
| SMA20 / SMA50 | 116.47 / 111.42 |
| RSI (14) / Stochastic %K | 61.7 / 74.3 |
| Bollinger %B / ATR | 95% / 4.89 |
| Support / Resistance 20 days | 110.00 / 128.10 |
| Data as of | 7 Agustus 2026 08:30 WIB |



