HSBC Stock Technicals Today: Drops 1.63%, Testing Support Level
On September 25, 2026: price 156.90 HKD, trend sideways, RSI 38.8, support 156.90, resistance 167.60. technical analysis of hsbc stock.

HSBC Holdings’ Hong Kong-listed shares fell to 156.90 HKD on 24 September 2026, down 1.63% from the previous close of 159.50, leaving the stock pressed against the lower edge of its recent trading band. The move matters less for the size of the one-day decline than for where it happened: the price is now sitting just under the lower Bollinger band at 156.82, while the broader setup remains sideways and below both short- and medium-term moving averages. As shown in the chart, the market is not breaking down in a dramatic way, but it is testing whether the recent range still has enough support to hold.
Trend & Price Action
The technical picture is one of gradual softening rather than a clean trend reversal. The stock is trading below SMA20 at 162.32 and below SMA50 at 162.14, which tells traders that recent prices have been weaker than the average of the last month and the last two months. When price stays under both averages, rallies tend to meet selling from investors who bought earlier and are waiting to get back to breakeven. The lack of a fresh MA-cross also matters: there is no new moving-average signal to suggest momentum has shifted decisively in either direction.
The slope of SMA20, at -0.38% over 5 days, reinforces that tone. It is not a steep downtrend, but it does show that short-term momentum has been leaning lower. The stock is also at 0% of the recent 20-hour range, with support marked at 156.90 and resistance at 167.60. That positioning says the market is testing the floor rather than comfortably trading in the middle of the band.
A short line says a lot here: the price is at the edge, not in control.
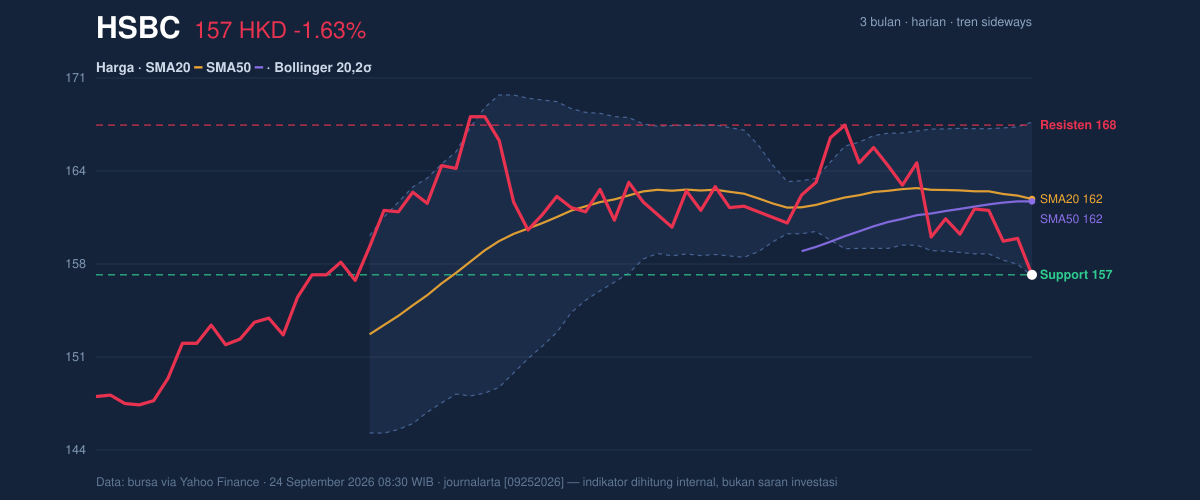
The broader 3-month range gives this move context. HSBC has traded between 145.40 and 169.70, so the current level is not near a multi-month breakdown, but it is close enough to the lower end of the range to show caution. In practical terms, the market is asking whether this is a routine dip inside a range or the start of another leg down.
Oscillators & Momentum
Momentum indicators are mixed, and that mix is important. The RSI(14) at 38.8 is still described as neutral, but it is leaning toward the weaker side of the scale. RSI measures the balance of recent gains and losses: readings below 50 usually imply sellers have had the upper hand, while readings near 30 are often associated with oversold conditions. HSBC is not there yet, which means the stock is weak, but not exhausted.
The more immediate signal comes from the Stochastic oscillator, where %K at 5.2 sits below %D at 10.5, a classic oversold reading. This often suggests the price has fallen fast enough that it may be stretched in the short term. But oversold does not mean a rebound is guaranteed; it only means the decline may be mature enough to attract bargain-hunting if other signals stabilize.
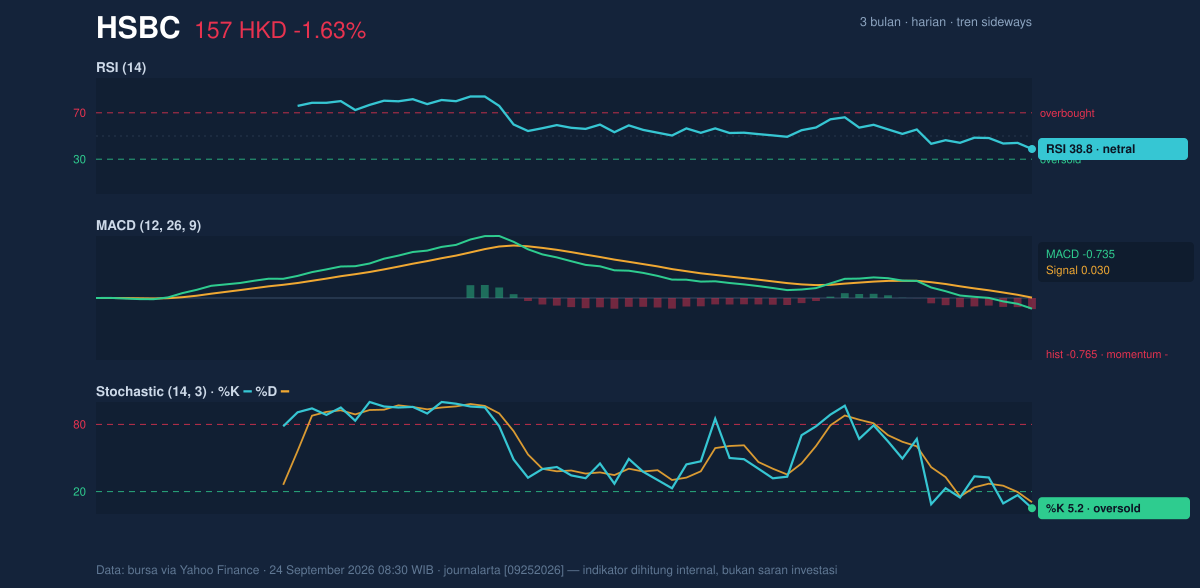
The bigger drag remains the MACD at -0.735, below its signal line at 0.030, with the histogram at -0.765. MACD is a trend-following momentum gauge, and this configuration says downward momentum is still in place. Put simply, the stock may be oversold in the short run, but the trend engine has not yet turned positive. That combination often leads to choppy trading: weak trend, brief rebounds, then renewed pressure unless buyers show up with conviction.
Volatility & Volume
Volatility is moderate, not extreme. The ATR(14) at 2.69, equal to about 1.7% of price, suggests a normal daily swing range for a large financial stock rather than panic conditions. The Bollinger Band width of 6.8% is narrowing, which points to a squeeze. In plain language, the market has compressed, and compressed markets often precede a sharper move once price escapes the band. The key question is direction.
The current %B at 1% shows the stock is near the lower boundary of the Bollinger structure, which aligns with the weak price action seen in the chart. When price hugs the lower band while momentum stays negative, it usually means sellers still control the near-term tape. Yet a squeeze can also create the conditions for a snapback if selling exhausts itself.
Volume does not yet confirm a decisive break. Last volume was 10,699,228, roughly 1.0x the 20-day average of 10,527,133. That is active, but not exceptional. In other words, the move lower is being accepted by the market, but not accompanied by a surge in participation that would signal panic or a capitulation washout. The OBV is falling, which is a quiet but important warning: on-balance volume tracks whether money flow is accumulating or leaving, and a declining OBV suggests sellers have had the upper hand over time.
Key Levels & Scenarios
The immediate technical map is straightforward. 156.90 is the first line of defense, and it is also the last traded price. If that area holds, the market can attempt to stabilize inside the compressed Bollinger structure. If it fails, the lower band at 156.82 offers only thin technical protection before attention shifts toward the lower part of the broader range.
On the upside, 162.14 to 162.32 is the first recovery zone because it combines the SMA50 and SMA20. A move back above that cluster would not erase the weakness, but it would show that short-term sellers are losing grip. Above that, 167.60 is the near-term resistance to watch, and then 167.81 at the upper Bollinger band becomes the next technical ceiling. A push through those levels would signal that the squeeze is resolving upward rather than continuing to leak lower.
Technical Verdict: HOLD (wait & see)
HOLD (wait & see)
- MACD remains negative at -0.735, so the trend momentum is still leaning lower.
- Price is below SMA20 and SMA50, keeping the stock under its short- and medium-term averages.
- Stochastic is oversold at %K 5.2 and %D 10.5, which argues for caution on fresh weakness because a rebound attempt is possible.
- Invalidation condition: this verdict is invalidated if price falls below 156.82, the lower Bollinger band and immediate technical floor.
- Ideal Entry Range: 156.82 to 162.14
- Exit Target: 167.60 to 167.81
- Stop Loss protection level: below 156.82
In plain English: HSBC is technically weak, but it is also close to a level where the market may try to steady itself.
Summary Data HSBC
| Last price | 156.90 HKD |
| Change 1 day / 5 days / 1 month | -1.63% / -1.81% / -3.03% |
| Trend / MA-cross | sideways / none |
| SMA20 / SMA50 | 162.32 / 162.14 |
| RSI (14) / Stochastic %K | 38.8 / 5.2 |
| Bollinger %B / ATR | 1% / 2.69 |
| Support / Resistance 20 days | 156.90 / 167.60 |
| Data as of | 24 September 2026 08:30 WIB |


