Alibaba Stock Gains 0.18%, Momentum Gains In Focus
On September 25, 2026: price 110.00 HKD, trend sideways, RSI 47.6, support 105.10, resistance 114.80. technical analysis of alibaba stock.

Alibaba Group’s Hong Kong-listed shares rose to HKD 110.00 in Thursday trading, edging up 0.18% from the previous close, while the chart still shows a market that is trying to stabilize rather than break cleanly in either direction.
The key signal is that the stock is sitting above the 20-day average at HKD 109.51 but still below the 50-day average at HKD 115.33, which is classic sideways behavior: short-term buyers are defending the area, but the broader trend has not yet turned decisively higher. The absence of a fresh MA-cross — when a shorter moving average crosses a longer one — matters because it means the chart has not produced a new trend confirmation signal. In plain terms, Alibaba is not in a strong downtrend, but neither is it showing the clean momentum of a renewed uptrend.
That matters because the stock has already lost 4.76% over the past month even after gaining 4.66% over five days. The mixed time frames suggest recent buying has improved sentiment, but not enough to undo the broader softness. The 20-day moving average is also sloping down 1.14% over five days, reinforcing the idea that the stock is still digesting earlier weakness.
A rebound is not the same as a reversal.
Trend & Price Action
As shown in the chart, Alibaba is trading in the middle of its recent band, with price at 51% of the 20-hour range between support at HKD 105.10 and resistance at HKD 114.80. That positioning is important: it says the market is neither stretched nor washed out, but rather balanced and waiting for a catalyst. The stock also sits well below the 3-month high of HKD 130.30 and above the 3-month low of HKD 88.65, which frames the current move as a recovery attempt inside a wider range rather than a breakout.
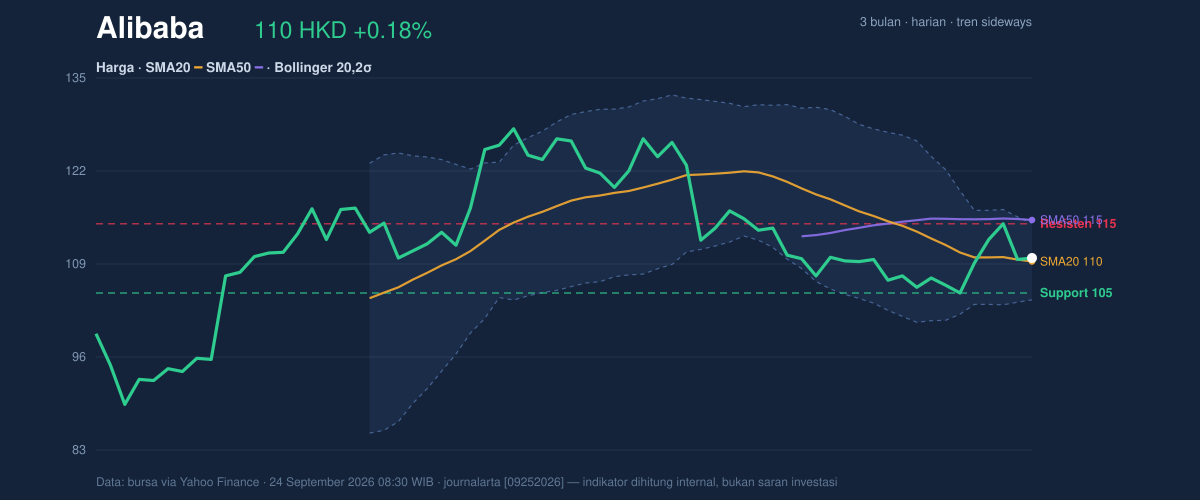
The Bollinger Bands add a second layer of context. Price is near the middle band at HKD 109.51, with the upper band at HKD 114.88 and lower band at HKD 104.14. Because the bands are only 9.8% wide and described as normal, the market is not in a volatility squeeze or expansion phase. That means a sharp move is not being telegraphed by the band structure alone; the stock is still in a contained range, and any clean break would likely need volume to validate it.
Oscillators & Momentum
The momentum picture is more constructive than the trend picture. RSI at 47.6 is neutral, which means Alibaba is neither overbought nor oversold and still has room to move in either direction. That neutrality is useful: it leaves the door open for follow-through without warning that the stock is already overheated. The Stochastic reading of 41.1 versus 52.0 is also neutral, but with %K below %D, it suggests momentum has not yet fully turned upward. In practical terms, buyers have not completely seized control.
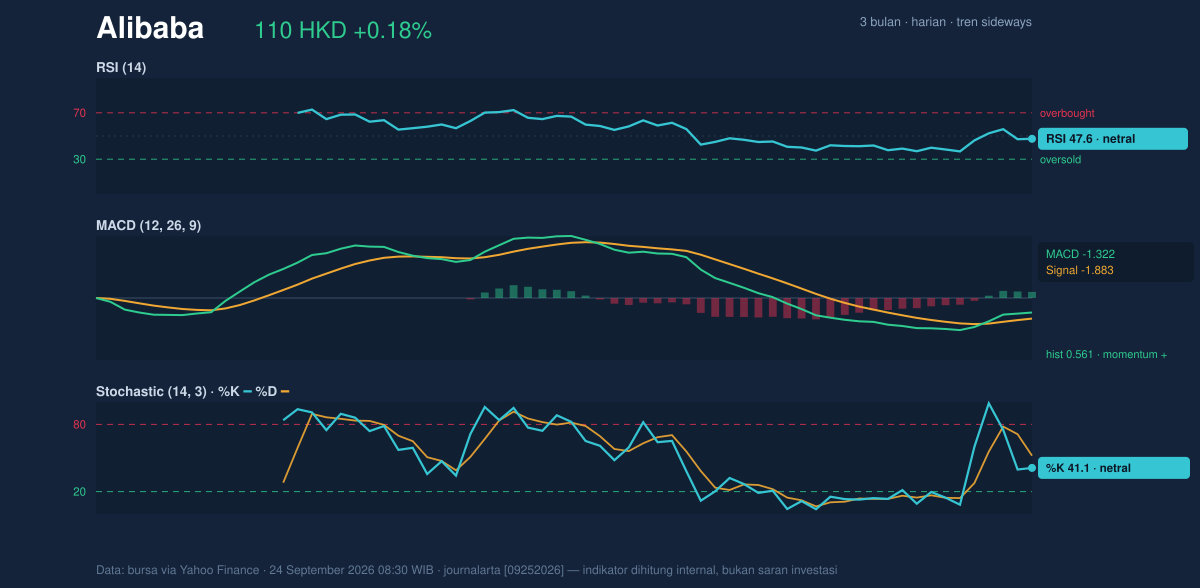
The strongest momentum clue comes from MACD. The line at -1.322 is still below zero, but it sits above the signal line at -1.883, leaving a positive histogram of 0.561. That combination usually means downside momentum is fading and a short-term recovery is in progress. It is not a bullish trend confirmation on its own, but it does show the market is improving from below. For readers, this is the difference between “less weak” and “strongly strong.”
Volatility & Volume
Volatility is moderate, not extreme. The ATR of 3.41, equal to 3.1% of price, implies that normal daily movement is still meaningful enough to create tradable swings, but not so large that the market is in panic mode. Volume, however, is the weak spot in the current setup. The latest turnover of 37,259,984 shares is only 0.6× the 20-day average of 66,599,138, which means the recent price action is happening on lighter participation than usual.
That matters because price moves without volume are easier to fade. Still, the OBV is rising, and that is a subtle positive: on-balance volume tracks whether money flow is accumulating or distributing over time. A rising OBV while volume is quiet suggests buyers may be gradually absorbing supply, even if the market has not yet attracted broad participation.
Key Levels & Scenarios
The immediate technical map is straightforward. HKD 105.10 is the first support to watch, while HKD 114.80 is the first resistance. Above that, the next reference is the 50-day average at HKD 115.33, which acts as a more important hurdle because reclaiming it would improve the medium-term structure. On the downside, a loss of HKD 104.14 — the lower Bollinger band — would suggest the recent stabilization is failing and that the market is slipping back into weakness.
If price can hold above HKD 109.51 and push through HKD 114.80, the chart would begin to look more constructive, especially if volume improves. If it slips back below HKD 105.10, the recovery thesis loses traction and the stock would likely revisit weaker parts of the range.
Technical Verdict: HOLD (wait & see)
HOLD (wait & see) is the cleanest reading from the chart because the stock is improving, but not yet confirmed.
- Reason 1: Price is above the SMA20 at HKD 109.51, which supports short-term stabilization.
- Reason 2: MACD is positive relative to its signal line, showing momentum is recovering, even though the line remains below zero.
- Reason 3: RSI at 47.6 and Stochastic at 41.1/52.0 are neutral, so the chart has room to improve but lacks a decisive thrust.
- Verdict invalidated if price falls below HKD 105.10, because that would break the nearest support and weaken the current base.
- Ideal Entry Range: HKD 105.10 to HKD 109.51
- Exit Target: HKD 114.80 to HKD 115.33
- Stop Loss protection: below HKD 104.14
In plain English: Alibaba’s chart is improving, but it still needs stronger confirmation before the move looks fully established.
Latest support remains HKD 105.10, with resistance at HKD 114.80.
Summary Data Alibaba
| Last price | 110.00 HKD |
| Change 1 day / 5 days / 1 month | 0.18% / 4.66% / -4.76% |
| Trend / MA-cross | sideways / none |
| SMA20 / SMA50 | 109.51 / 115.33 |
| RSI (14) / Stochastic %K | 47.6 / 41.1 |
| Bollinger %B / ATR | 55% / 3.41 |
| Support / Resistance 20 days | 105.10 / 114.80 |
| Data as of | 24 September 2026 08:30 WIB |


