Alibaba Stock Drops 1.45% Today, Momentum Gains
On September 28, 2026: price 108.40 HKD, trend downtrend, RSI 45.2, support 105.10, resistance 114.80. technical analysis of alibaba stock.

Alibaba Group’s Hong Kong-listed shares fell to 108.40 HKD on the Hong Kong exchange, extending a short-term slide that has left the stock below its 20-day average and still well under its 50-day trend line, according to data cited from Yahoo Finance. The move matters because it shows the market is still treating recent bounces as corrective rather than decisive: price is sitting in the lower third of its near-term range, momentum is mixed, and participation was thin even as the broader trend remains pointed lower.
Trend & Price Action
The most important signal on the chart is that Alibaba is trading below its SMA20 at 109.24 and far beneath its SMA50 at 115.24, which keeps the stock in a downtrend. The SMA20 slope is falling at -0.78% over five days, a useful sign because it shows the short-term average is not merely flat — it is still drifting lower, meaning sellers have been able to cap rebounds faster than buyers can sustain them.
That also explains why the absence of a fresh MA-cross matters. A “golden cross” or “death cross” is when a short average crosses a longer one; here, there is no new crossover, so the chart is not giving a clean reversal signal. Instead, the stock remains in a transitional zone where the market has not yet proven that the downtrend is over.
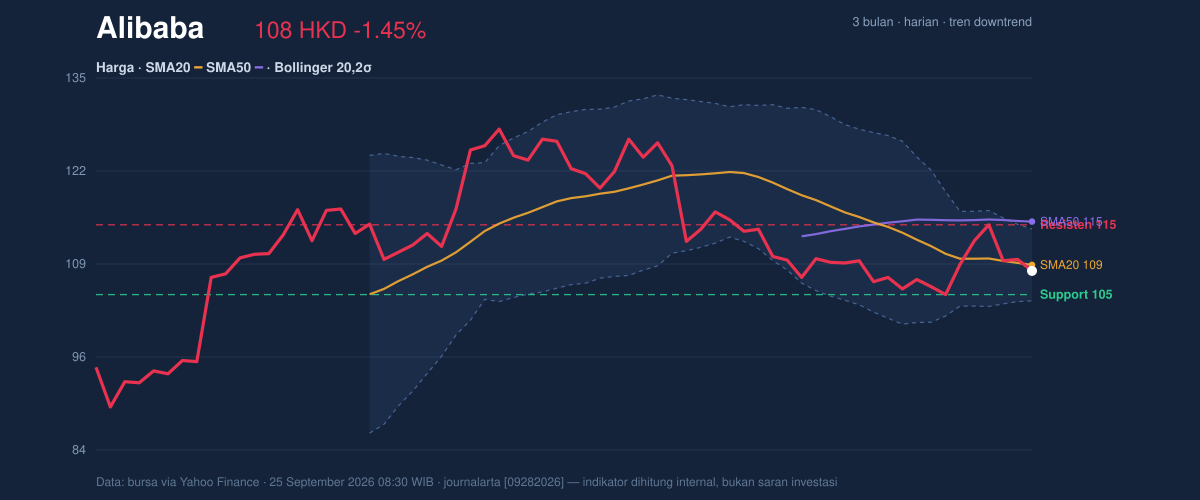
The range position is equally telling. With support at 105.10 and resistance at 114.80, the share price is only around 34% of the way up the range. In plain language, Alibaba is closer to the floor than the ceiling, but not yet at a level that would normally imply strong downside exhaustion. The broader three-month band from 88.65 to 130.30 shows there is still plenty of historical room in both directions, but the current tape is behaving as a mean-reversion trade inside a larger corrective phase.
Short sentence: the chart is weak, but not broken.
Oscillators & Momentum
The oscillator picture is more balanced than the trend picture. RSI at 45.2 is neutral, which means the stock is neither overbought nor oversold. That is important because it tells readers not to expect a momentum washout or a euphoric breakout from the RSI alone. The reading is consistent with a market that has cooled off without reaching a capitulation extreme.
The Stochastic %K at 29.8 and %D at 36.9 also sit in neutral territory, though close to the lower end of the range. Stochastic is useful for spotting whether a stock is stretched relative to its recent trading band; here it suggests Alibaba is soft, but not in a deeply oversold condition that would automatically trigger a reversal.
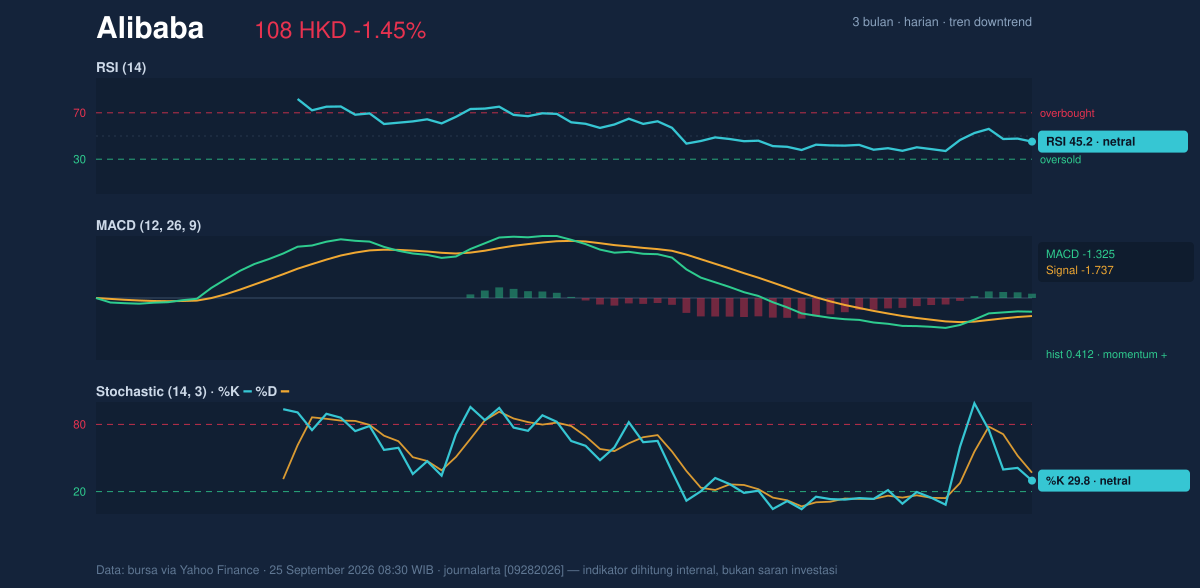
The more constructive detail comes from MACD. The indicator is at -1.325, with the signal line at -1.737 and a positive histogram of 0.412. That combination means the MACD line is still below zero, so longer-term momentum is not yet bullish, but it has moved above its signal line, showing that downside momentum is easing. In practical terms, the stock is no longer accelerating lower as fast as before, but the chart has not yet flipped into a confirmed uptrend.
Volatility & Volume
Bollinger Bands add another layer of context. The price is below the middle band at 109.24, with the upper band at 114.23 and lower band at 104.24. The stock’s %B of 42% places it below the midline, but not pressed against the lower band, which usually means the market is drifting rather than breaking down in an urgent way. The 9.1% band width is normal, so this is not a classic squeeze setup where volatility is compressed and a sharp move is imminent. Instead, the bands suggest a steady, moderate trading environment.
ATR reinforces that reading. At 3.54, or about 3.3% of price, Alibaba is showing moderate volatility. That matters because it frames how quickly the shares can move through nearby levels: the stock is active enough to test support or resistance in a single session, but not so wild that one day’s move automatically changes the structure.
Volume, however, is the caution flag. The latest turnover of 28,037,888 shares was only 0.4 times the 20-session average of 64,346,706, which means the latest decline happened on quiet participation. Thin volume often weakens the conviction behind a move; in this case, it suggests sellers did not need broad panic to push the stock lower. At the same time, OBV is rising, which hints that underlying accumulation has not disappeared. That divergence — weak day-to-day volume but improving on-balance volume — is one of the more interesting signals in the file, because it suggests some investors are still stepping in on dips even while the price trend remains under pressure.
Key Levels & Scenarios
The immediate technical map is straightforward. 105.10 is the first level to watch on the downside. If that floor gives way, the chart would likely shift from a controlled pullback toward a more damaging retracement, especially because the stock is already below its short and medium moving averages. On the upside, 109.24 is the first checkpoint, followed by 114.23 to 114.80, where both Bollinger resistance and range resistance converge. That cluster is important because it marks the area where any rebound would need to prove it has real buying support, not just short-covering.
The cleanest read is conditional: if Alibaba can reclaim the 109.24 middle band and then challenge 114.80, the market would begin to repair the current bearish structure. If it fails to hold 105.10, the current range loses its balance and downside pressure would likely intensify.
Technical Verdict: HOLD (wait & see)
HOLD (wait & see)
- Trend remains negative: price is below SMA20 at 109.24 and SMA50 at 115.24, with the SMA20 still sloping down.
- Momentum is improving but not confirmed: MACD histogram is positive at 0.412, yet RSI at 45.2 and Stochastic at 29.8/36.9 stay neutral.
- Participation is weak: volume ran at only 0.4 times the 20-session average, even though OBV is rising.
- Verdict invalidated if price falls below 105.10.
- Ideal entry range: 105.10 to 109.24
- Exit target: 114.23 to 114.80
- Stop loss protection: below 104.24
In plain English, the stock is still under pressure, but the chart has not yet broken enough to call the next move decisively lower.
Summary Data Alibaba
| Last price | 108.40 HKD |
| Change 1 day / 5 days / 1 month | -1.45% / -0.82% / -4.83% |
| Trend / MA-cross | downtrend / none |
| SMA20 / SMA50 | 109.24 / 115.24 |
| RSI (14) / Stochastic %K | 45.2 / 29.8 |
| Bollinger %B / ATR | 42% / 3.54 |
| Support / Resistance 20 days | 105.10 / 114.80 |
| Data as of | 25 September 2026 08:30 WIB |


