AIA Stock Drops 2.70%, Testing Support Level In Focus
On September 28, 2026: price 73.75 HKD, trend sideways, RSI 40.3, support 73.75, resistance 77.50. technical analysis of aia stock. AIA Stock Drops — full…

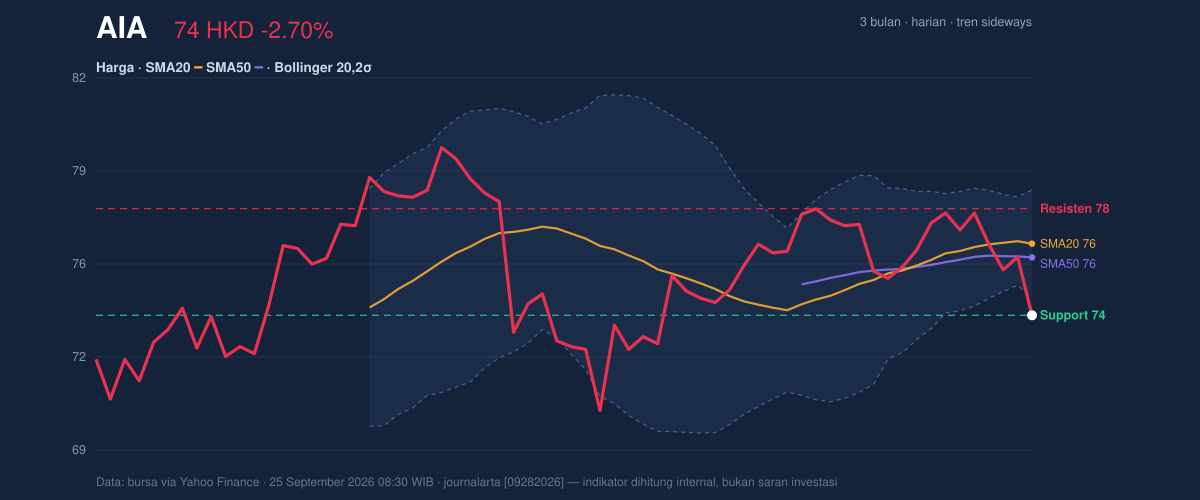
AIA Group’s shares fell to 73.75 HKD on HKEX, down 2.70% from the previous close of 75.80, and the move matters because it pushed the stock to the very bottom of its recent trading band. As shown in the chart, the price is now trading below the 20-day SMA at 76.27 and also under the 50-day SMA at 75.79, a setup that usually tells investors the short-term trend has lost traction even if the broader pattern is still described as sideways. The absence of a fresh moving-average cross means this is not yet a full trend reversal signal, but it does show that the stock is leaning weak while it tests nearby support.
Trend & Price Action
The chart shows a market that has been drifting rather than trending cleanly. The sideways label fits the data: the 20-day average is rising only modestly, with a slope of 0.34% over 5 days, which suggests stabilization rather than strong upside momentum. But price sitting beneath both the 20-day and 50-day averages tells a different story in the short run. That positioning often signals that rallies are meeting supply before they can establish a new leg higher.
The most important reference point is the 73.75 HKD support, which is also the latest price. That means the stock is effectively sitting on its nearest floor rather than comfortably above it. The 77.50 HKD resistance is the first level that would need to be reclaimed to show buyers are regaining control of the range. Until then, the stock remains compressed near the lower edge of its 3-month range of 69.35 to 80.15, which is a sign of indecision after a broader swing lower from the upper half of that band.
Oscillators & Momentum
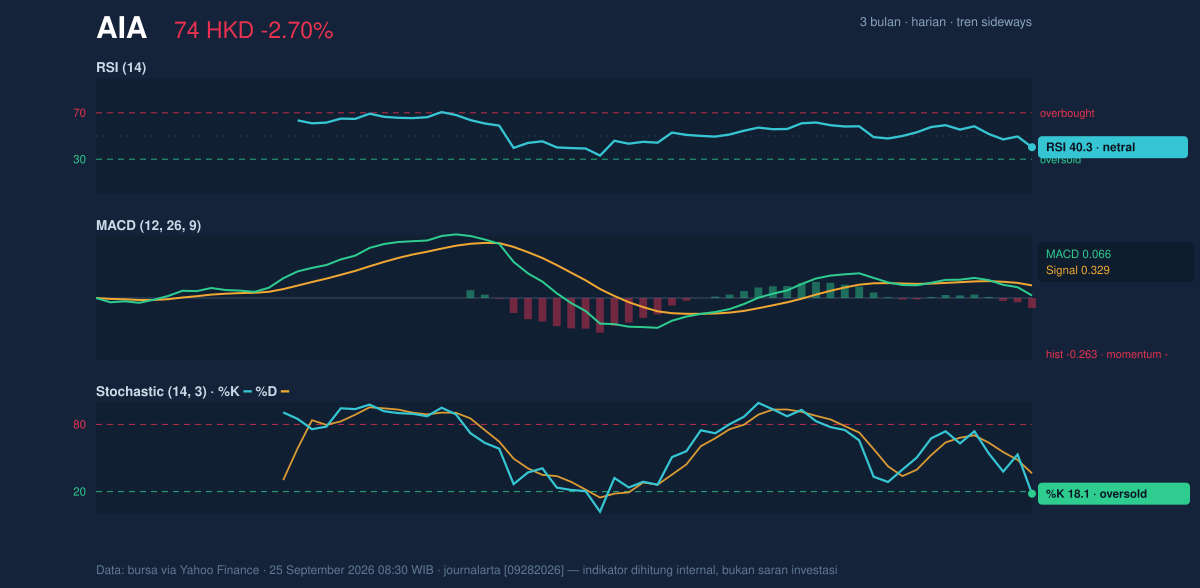
The momentum picture is mixed, and that is the key signal. The RSI at 40.3 is still neutral, meaning the stock is not oversold enough on that measure to imply exhaustion, but it is weak enough to show buyers have not been aggressive. By contrast, the Stochastic %K at 18.1 and %D at 36.4 points to oversold conditions. In plain language, the stock has been sold down quickly enough that a short-term bounce becomes more plausible, but not guaranteed.
That tension is visible in the MACD reading. The MACD histogram at -0.263 shows momentum remains negative even though the MACD line at 0.066 is still above zero. The gap between MACD and its signal line, 0.329, says the recent price action has weakened relative to the prior trend. For non-specialists, this usually means the stock may be losing speed before it has fully changed direction. As shown in the chart, the oscillators are not aligned: Stochastic is flashing short-term exhaustion, while MACD still says the downshift has not been reversed.
Volatility & Volume
Volatility is present, but not extreme. The ATR of 1.71, equal to 2.3% of price, suggests daily movement remains meaningful without being disorderly. That matters because a stock near support can either stabilize quietly or break sharply; ATR helps show the likely scale of that move. Here, the range is not wide enough to imply panic, but it is wide enough to allow a decisive test of nearby levels.
Bollinger Bands add another layer. The lower band at 74.37 is now above the latest price, and the %B at -16% shows the stock is trading below the lower band, a sign of short-term weakness and potential overshoot. At the same time, the 5.0% band width indicates a squeeze, which often precedes a breakout or breakdown because volatility has been compressed. In practical terms, the stock is being squeezed into a tighter range while momentum softens, so the next directional move could be more important than the recent drift.
Volume does not yet confirm a strong escape from that pattern. Last volume was 25,253,318, close to the 20-hour average of 26,198,571, or about 1.0× normal. That means the latest selloff did not come with a dramatic surge in participation. The OBV is rising, which is constructive because on-balance volume tracks whether money flow is generally accumulating or distributing. Rising OBV while price is weak can hint that longer-term holders are not abandoning the stock, even if short-term momentum is still under pressure.
Key Levels & Scenarios
The immediate battle is between the 73.75 HKD support and the 74.37 HKD lower Bollinger band on one side, and the 75.79 to 76.27 HKD moving-average zone on the other. If price can recover above the middle band at 76.27 HKD, that would be the first sign the squeeze is resolving in a steadier direction. A move through 77.50 HKD resistance would matter more because it would show the stock is no longer pinned near the bottom of its range.
If the current level fails, the next reference is the lower end of the 3-month low at 69.35. That is not a forecast, but it is the next visible historical anchor if support gives way. The fact that the stock is already at the bottom of the 20-hour range means there is little cushion before the chart shifts from range-bound weakness to a more pronounced decline.
Technical Verdict: HOLD (wait & see)
HOLD (wait & see) fits the setup because the stock is weak, but not weak enough to confirm a clean breakdown, while oversold signals are beginning to appear.
- RSI at 40.3 is neutral, so the stock is not yet washed out on the broader momentum gauge.
- Stochastic at 18.1 / 36.4 is oversold, which hints at a possible short-term bounce.
- MACD histogram at -0.263 remains negative, so trend momentum is still leaning down.
- Verdict invalidated if price breaks below 73.75 HKD, because that would mean the current support has failed.
- Ideal entry range: 73.75 to 74.37 HKD
- Exit target: 75.79 to 76.27 HKD
- Stop loss protection: below 69.35 HKD
For non-traders, this means the stock is sitting at a fragile support area where a rebound is possible, but the chart has not yet proved that the weakness has ended.
Summary Data AIA
| Last price | 73.75 HKD |
| Change 1 day / 5 days / 1 month | -2.70% / -3.91% / -2.32% |
| Trend / MA-cross | sideways / none |
| SMA20 / SMA50 | 76.27 / 75.79 |
| RSI (14) / Stochastic %K | 40.3 / 18.1 |
| Bollinger %B / ATR | -16% / 1.71 |
| Support / Resistance 20 days | 73.75 / 77.50 |
| Data as of | 25 September 2026 08:30 WIB |


