UOB Stock Technicals Today: Gains 0.16%, Testing Key Resistance
On September 28, 2026: price 42.57 SGD, trend sideways, RSI 57.7, support 40.99, resistance 42.84. technical analysis of uob stock. UOB Stock Technicals — full…

United Overseas Bank’s shares on SGX edged up to SGD 42.57, a modest gain from the previous close of 42.50, but the more important signal is that the stock is still trading above both its short- and medium-term averages while momentum remains constructive. The price action, as shown in the chart, suggests UOB is not in a breakout yet, but it is also not showing the kind of deterioration that usually precedes a sharper pullback. Instead, the setup looks like a stock consolidating near the upper half of its recent range, with the market waiting for a clearer catalyst.
Trend & Price Action
UOB is in a sideways trend, and that matters because sideways does not mean directionless; it usually means the market is pausing to decide whether recent gains deserve to be extended. The share price is above the SMA20 at 41.83 and the SMA50 at 42.06, which is a mild positive sign because shorter-term trading is still sitting above the broader recent average. There is no fresh MA-cross, so the chart is not flashing a new trend regime; instead, it is showing continuity, with the SMA20 slope at 1.04% over 5 days hinting that the short-term base is still rising.
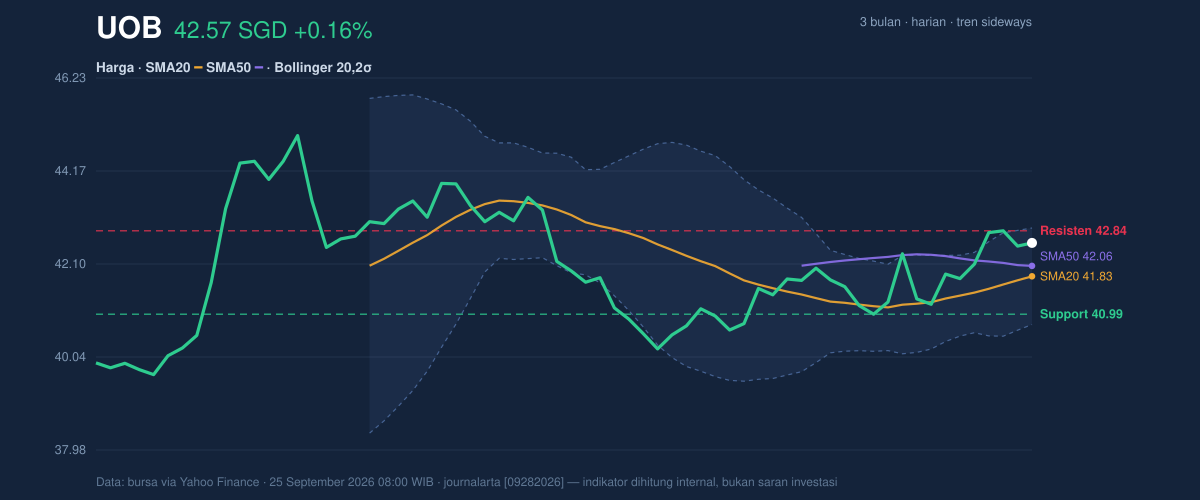
The stock is also near the top of its recent band. With support at 40.99 and resistance at 42.84, UOB is trading at about 85% of the range, which tells readers the market is leaning upward, but not aggressively enough to clear resistance decisively. The 3-month high of 45.15 and low of 39.42 frame the broader battleground: the shares are closer to the upper end of that corridor, yet still short of the recent peak that would confirm a stronger trend. That positioning matters because stocks often stall near resistance when volume is not strong enough to validate a move.
Oscillators & Momentum
The momentum picture is better than the headline “sideways” label might suggest. RSI at 57.7 is neutral, which means the stock is neither stretched nor washed out; in plain language, there is room for further upside without immediately triggering overbought concerns. The Stochastic %K at 69.2 and %D at 72.0 are also neutral, but they sit in the upper part of the range, implying near-term momentum is firm without yet reaching a classic exhaustion zone. That combination usually signals a market that is advancing, but with enough hesitation to keep traders alert for a pause.
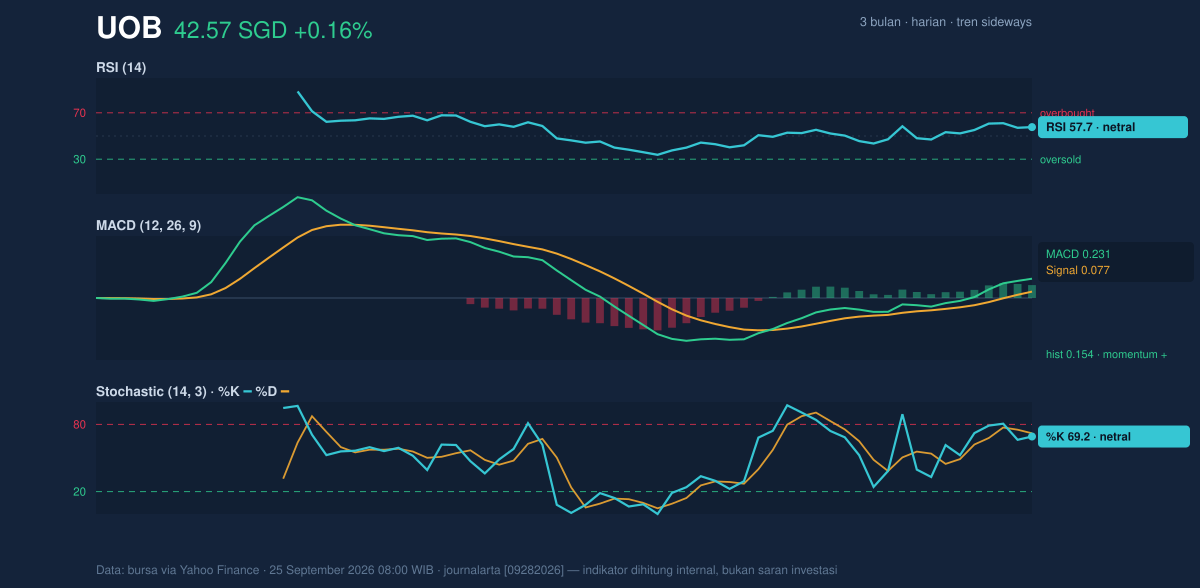
The more convincing evidence comes from MACD at 0.231 versus a signal line at 0.077, with a histogram of 0.154. In technical terms, MACD measures whether recent price action is gaining or losing traction; here, the positive histogram shows the gap between the MACD line and its signal line is still widening in favor of the bulls. That is not a guarantee of a breakout, but it does mean the underlying impulse remains positive even while the broader trend is only sideways. The message is simple: momentum is supportive, but not yet strong enough to overpower resistance on its own.
Volatility & Volume
Volatility is present, but not excessive. ATR(14) at 0.73, or 1.7% of price, suggests daily swings are moderate rather than wild, which often suits a stock that is coiling rather than trending hard. The Bollinger Bands tell a similar story. With the upper band at 42.90, the middle band at 41.83, and the lower band at 40.76, the share price is sitting above the middle line and close to the upper band, while %B at 85% indicates it is trading near the top portion of the band structure. That usually means buyers have the upper hand in the short term, though not so strongly that the stock is visibly overextended.
The more interesting part is the 5.1% Bollinger band width, which is narrowing. A squeeze like this often signals compressed volatility and the possibility of a sharper move once the price escapes the band structure. In other words, the chart is not promising direction, but it is warning that direction may come soon. Volume, however, is not yet confirming conviction. The latest turnover of 2,819,000 is below the 20-day average of 3,176,213, or roughly 0.9x normal, which suggests the latest advance has not been powered by exceptional participation. The OBV is rising, though, and that is a constructive divergence: on-balance volume tracks whether volume is flowing into up days or down days, so a rising OBV implies accumulation is still edging ahead of distribution.
Key Levels & Scenarios
The immediate technical map is fairly clear. Resistance at 42.84 is the first ceiling to watch, and the nearby upper Bollinger band at 42.90 reinforces that zone as a short-term test. If the stock can clear that area with stronger participation, the chart would look less like a range and more like an attempted expansion from a squeeze. On the downside, support at 40.99 is the first line of defense, followed by the Bollinger lower band at 40.76. A failure below that band would weaken the current constructive setup and suggest the recent rise has run into selling pressure rather than building a new base.
The broader range still matters because the shares have spent time between 39.42 and 45.15 over the last three months. That means the current price is not chasing a new extreme; it is testing the upper half of a known range, where gains often need better volume and stronger momentum to continue.
Technical Verdict: HOLD (wait & see)
HOLD (wait & see)
- MACD is positive, and the histogram remains above zero, which supports the current upward bias.
- Price is above SMA20 and SMA50, so the stock has not lost its short- to medium-term footing.
- Bollinger bands are squeezing, which raises the chance of a directional move, but volume is still only 0.9x normal, so confirmation is missing.
- Verdict invalidated if price falls below 40.76, the lower Bollinger band and near-term support zone.
- Ideal Entry Range: 40.99 to 41.83
- Exit Target: 42.84 to 42.90
- Stop Loss Protection: below 40.76
For non-traders, this means UOB’s chart is firm enough to stay on the radar, but not strong enough yet to prove the next move will be higher. The next scheduled technical test is the attempt to clear 42.84.
Summary Data UOB
| Last price | 42.57 SGD |
| Change 1 day / 5 days / 1 month | 0.16% / 1.89% / 4.39% |
| Trend / MA-cross | sideways / none |
| SMA20 / SMA50 | 41.83 / 42.06 |
| RSI (14) / Stochastic %K | 57.7 / 69.2 |
| Bollinger %B / ATR | 85% / 0.73 |
| Support / Resistance 20 days | 40.99 / 42.84 |
| Data as of | 25 September 2026 08:00 WIB |


