UOB Stock Technicals Today: Gains 0.17%, Momentum Gains
On September 16, 2026: price 41.33 SGD, trend sideways, RSI 58.1, support 40.22, resistance 42.33. technical analysis of uob stock. UOB Stock Technicals — full…

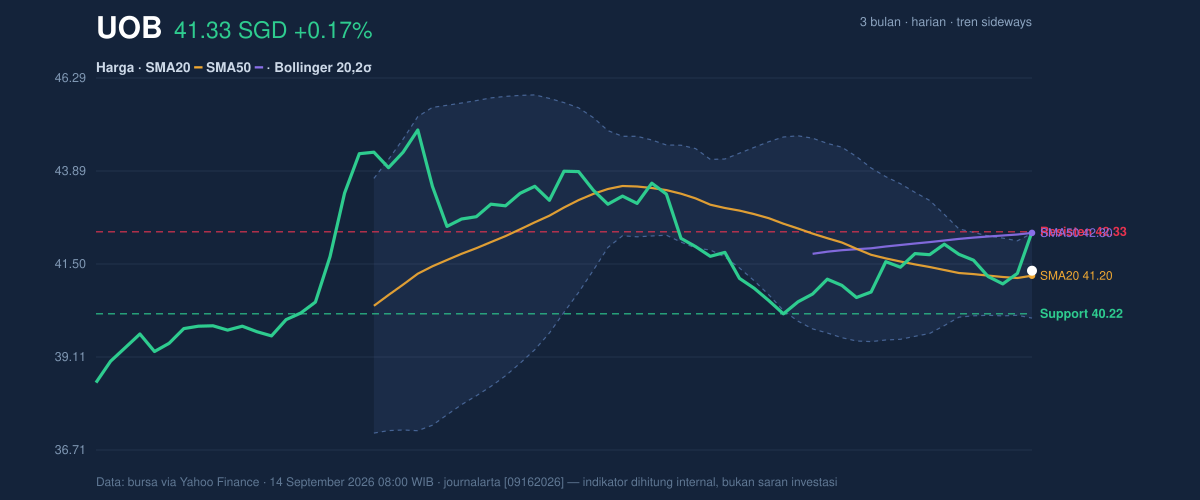
United Overseas Bank rose to SGD 41.33 on the SGX on 14 September 2026, edging above the previous close of 41.26 as the stock continued to trade in a sideways pattern rather than a decisive trend. The move looks modest on the surface, but the chart is sending a more nuanced message: price is holding above the 20-day average at 41.20 while still sitting well below the 50-day average at 42.30, which means short-term stability has improved, but the broader trend has not yet flipped into a cleaner uptrend. As shown in the chart, that leaves UOB in a narrow decision zone where momentum, volume, and volatility are all starting to matter more than the day’s small price change.
Trend & Price Action
[ GRAFIK-HARGA ]
The most important signal in the price structure is that UOB is trading above SMA20 but below SMA50, a classic sign of a market that has recovered from weakness but has not yet reclaimed medium-term control. The SMA20 slope is slightly negative at -0.17% over 5 days, which tells readers that the short-term trend is still soft even though the latest price is holding up. In plain language, the stock is not falling apart, but neither is it building a convincing upward staircase.
That matters because the Bollinger setup is compressing. The bands are 40.11 on the lower side and 42.29 on the upper side, with the middle band at 41.20 and a relatively tight 5.3% width. A squeeze like this often means the market is storing energy, not that direction is already decided. With the price at 41.33, or roughly the middle of the range, the stock is not stretched toward either boundary, which reduces immediate breakout conviction but also leaves room for a move if volume keeps building.
The broader range also frames the current setup. UOB’s 20-hour support is 40.22 and 20-hour resistance is 42.33, while the 3-month high is 45.15 and the 3-month low is 38.20. That places the stock in the upper half of its three-month band, but not near the highs that would signal a stronger trend reset. The market is still testing whether recent stabilization can become something more durable.
Oscillators & Momentum
[ GRAFIK-MOMENTUM ]
The oscillator mix is constructive, but not fully aligned. RSI at 58.1 is neutral-to-firm, which usually suggests there is room for further gains without the stock being technically overheated. By contrast, the Stochastic %K at 89.1 versus %D at 50.6 is an overbought reading, and that often means the short-term rally has moved faster than the underlying trend has justified. In other words, buyers have been active enough to push price higher, but the move may be getting ahead of itself.
The MACD at -0.064 with a signal line at -0.159 and a positive histogram of 0.094 is the more interesting signal. MACD is still slightly below zero, which means the stock has not fully escaped its recent weakness, but the histogram being positive shows the gap is narrowing in favor of momentum improvement. That combination often appears before a trend change, though it is not confirmation by itself. For now, momentum is improving faster than the price structure has repaired.
Volatility & Volume
UOB’s ATR(14) is 0.55, or about 1.3% of price, which points to relatively low day-to-day volatility. Low ATR can be helpful for stability, but in a compressed Bollinger environment it can also be the calm before a sharper move. The key signal is not the quiet itself; it is whether the next move comes with participation.
Volume suggests participation is present, but the breadth of conviction is less clear. The latest turnover of 4,836,400 shares is about 1.7× the 20-session average of 2,853,555, which means more investors were active than usual. Yet OBV is down, and that divergence matters. On-balance volume tracks whether volume is flowing into or out of the stock over time; if it is falling while price steadies, it implies that recent buying has not fully erased earlier distribution. Put simply, the market is trading more, but the longer-term volume ledger still looks cautious.
That combination — higher volume, falling OBV, and a narrow Bollinger band — often precedes a directional break, but not always in the direction traders hope for. As shown in the chart, the stock needs to prove that the heavier activity is accumulation, not just short-lived repositioning.
Key Levels & Scenarios
The immediate technical map is straightforward. 40.22 is the first support level to watch, because a drop below it would suggest the recent stabilization has failed. On the upside, 42.29 to 42.33 forms the first resistance cluster, combining the upper Bollinger band and the 20-hour resistance. A close above that zone would be the clearest sign that the squeeze is resolving upward. The next reference beyond that is the 50-day average at 42.30, which overlaps the resistance area and reinforces its importance.
If price stays between 40.22 and 42.33, the stock remains range-bound and technically unresolved. If it breaks above that ceiling with volume, the chart would begin to favor a stronger recovery phase. If it slips below support, the sideways base would weaken quickly and the recent momentum readings would lose credibility.
Technical Verdict: HOLD (wait & see)
- Reason 1: Price is holding above SMA20 at 41.20, but still below SMA50 at 42.30, so the stock has improved without confirming a broader trend reversal.
- Reason 2: MACD is positive on the histogram, which supports improving momentum, but Stochastic is overbought, warning that the short-term move may be stretched.
- Reason 3: The Bollinger Bands are squeezing and volume is 1.7× average, which suggests a breakout may be forming, but OBV is down, so the volume message is not fully confirmed.
- Verdict invalidated if price falls below 40.22, because that would break the nearest support and weaken the current base.
- Ideal Entry Range: 40.22 to 41.20
- Exit Target: 42.29 to 42.33
- Stop Loss protection: below 40.11
In plain English, UOB looks stable but not yet convincing, and the next move should tell the market whether this is a pause or the start of a better run.
Summary Data UOB
| Last price | 41.33 SGD |
| Change 1 day / 5 days / 1 month | 0.17% / -1.01% / 0.49% |
| Trend / MA-cross | sideways / none |
| SMA20 / SMA50 | 41.20 / 42.30 |
| RSI (14) / Stochastic %K | 58.1 / 89.1 |
| Bollinger %B / ATR | 56% / 0.55 |
| Support / Resistance 20 days | 40.22 / 42.33 |
| Data as of | 14 September 2026 08:00 WIB |



