UOB Testing Key Resistance: Stock Gains 0.07% (September 30, 2026)
On September 30, 2026: price 43.32 SGD, trend sideways, RSI 63.7, support 40.99, resistance 43.32. technical analysis of uob stock. UOB Testing Key Resistance…

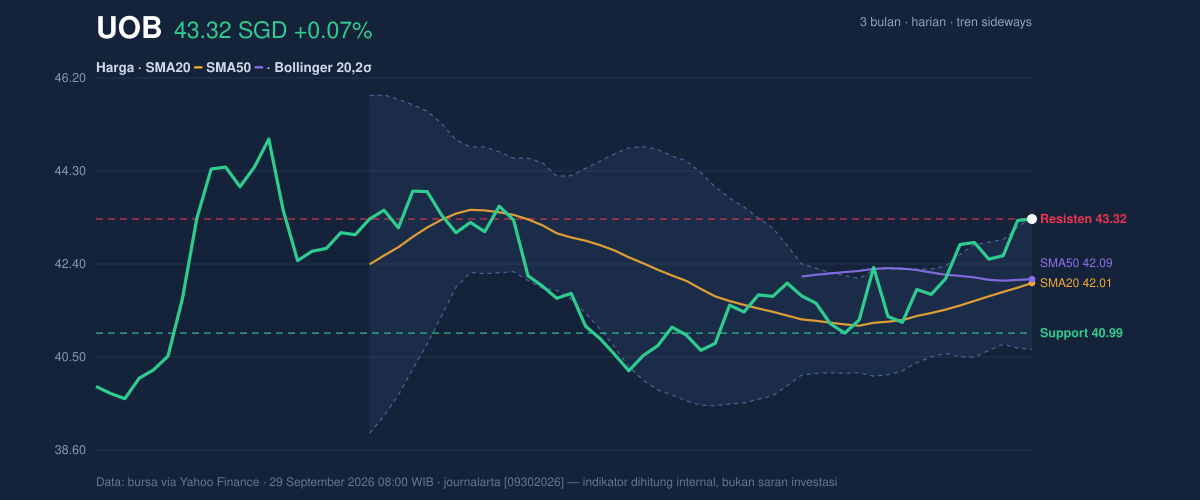
United Overseas Bank’s shares on SGX were little changed at SGD 43.32 as of 29 September 2026, but the stock is now pressing against the top of its recent range, with the latest print matching the 20-day resistance at SGD 43.32 and sitting just under the Bollinger upper band at SGD 43.37. That matters because price is not merely drifting higher; it is doing so while volume has expanded to 5,260,800, or about 1.6× the 20-day average, which suggests real participation rather than a quiet move on thin trading.
Trend & Price Action
The broader tone is still best described as sideways, even though the short-term slope is leaning upward. UOB is trading above both its SMA20 at SGD 42.01 and SMA50 at SGD 42.09, which tells investors the share price has recovered enough to hold above its recent average levels. Yet there is no fresh MA-cross, so the chart does not show a new trend regime; instead, it shows a stock trying to push out of a range that has been compressing for weeks.
That range context is important. The share price is already at 100% of its 20-day range, with the nearest support at SGD 40.99 and the 3-month low at SGD 39.50, while the 3-month high stands at SGD 45.15. In plain terms, UOB is no longer sitting in the middle of the field; it is testing the upper boundary, where gains often slow unless fresh buying appears. As shown in the chart, the price is leaning on the upper edge of the Bollinger envelope rather than breaking cleanly away from it.
Oscillators & Momentum
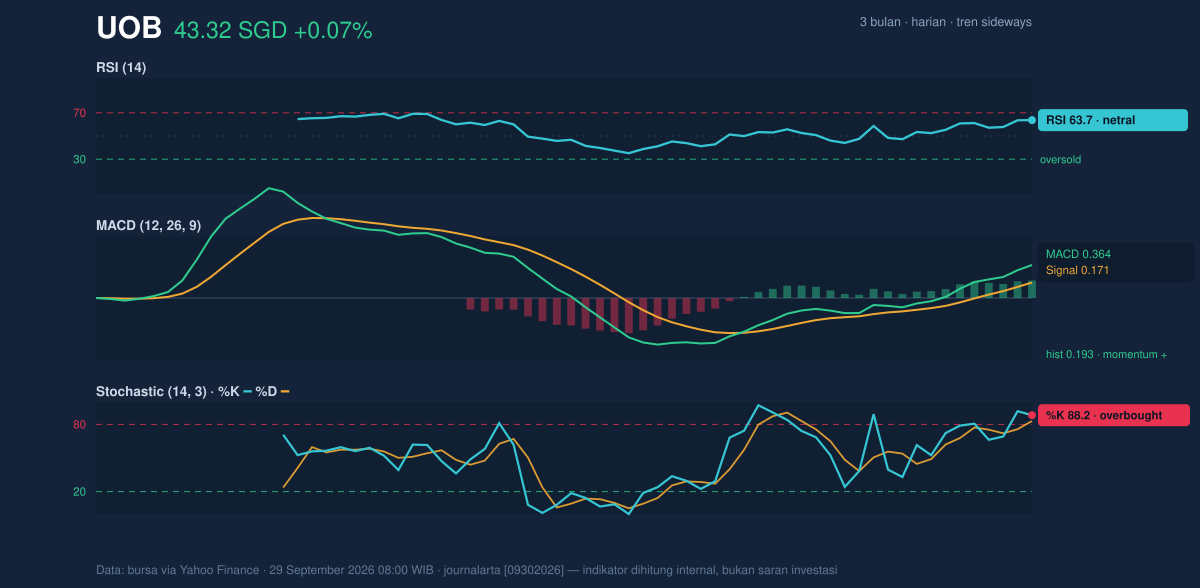
The momentum picture is mixed, and that is where the chart becomes more revealing than the headline price change. RSI at 63.7 is still broadly neutral, which means the stock is not yet in a stretched condition by that measure, but it is moving closer to the upper end of its comfort zone. By contrast, Stochastic %K at 88.2 and %D at 83.1 are both in overbought territory, signaling that short-term enthusiasm is already elevated.
That combination usually means the move has energy, but it may be getting ahead of itself. The MACD at 0.364 remains above the signal line at 0.171, with a positive histogram of 0.193, which confirms that upward momentum is still intact. In practical terms, the MACD says the trend has not rolled over; the Stochastic says the stock may need to pause or digest gains before it can extend further. As shown in the momentum chart, this is a constructive but somewhat stretched setup.
Volatility & Volume
Volatility is not excessive, but it is tightening. The Bollinger Bands are narrowing, with a band width of 6.4%, which points to a squeeze and raises the odds of a sharper move if price escapes the current band. Because the last price is sitting at %B 98%, UOB is essentially pinned near the top of that envelope. That usually signals strength, but it also leaves less room for error if buyers hesitate.
The ATR(14) at 0.76, or about 1.8% of price, indicates moderate daily movement rather than a highly volatile tape. Volume is the more convincing part of the setup: the latest session came in well above average, and OBV is rising, which means the recent advance has been supported by net accumulation rather than distribution. In technical terms, rising OBV alongside higher-than-average volume tends to validate a move, especially when price is testing resistance.
Key Levels & Scenarios
The immediate battleground is clear. SGD 43.32 is both the latest price and the current resistance marker, while SGD 43.37 is the Bollinger upper band just overhead. A clean move above that zone would show that buyers have absorbed near-term supply and may open the way toward the 3-month high at SGD 45.15. If price fails here, the first area to watch is the SMA20 at SGD 42.01, then the SMA50 at SGD 42.09, which are close enough to act as a support cluster rather than separate lines.
The signal quality improves if price can hold above the moving averages while volume stays elevated. If it slips back below the 20-day support at SGD 40.99, the current breakout attempt would lose credibility quickly, because that would place price back inside the lower part of the recent range and weaken the case for sustained upside. The chart is therefore less about predicting a straight-line move and more about whether UOB can convert a compressed range into a clean expansion.
Technical Verdict: HOLD (wait & see)
HOLD (wait & see)
- MACD is positive, so the medium-term momentum remains constructive.
- Stochastic is overbought, which warns that short-term upside may be stretched.
- Price is at resistance and near the Bollinger upper band, so confirmation is still needed before the move can be treated as durable.
Verdict invalidated if price falls below SGD 40.99.
- Ideal Entry Range: SGD 42.01 to SGD 42.09
- Exit Target: SGD 43.37, with the next chart reference at SGD 45.15
- Stop Loss Protection: Below SGD 40.99
For non-traders, this means the stock looks firm, but it is still waiting to prove that it can move beyond its current ceiling.
Summary Data UOB
| Last price | 43.32 SGD |
| Change 1 day / 5 days / 1 month | 0.07% / 1.21% / 4.59% |
| Trend / MA-cross | sideways / none |
| SMA20 / SMA50 | 42.01 / 42.09 |
| RSI (14) / Stochastic %K | 63.7 / 88.2 |
| Bollinger %B / ATR | 98% / 0.76 |
| Support / Resistance 20 days | 40.99 / 43.32 |
| Data as of | 29 September 2026 08:00 WIB |

