UOB Stock Analysis: Drops 0.79%, Testing Key Resistance
On September 25, 2026: price 42.50 SGD, trend sideways, RSI 57.0, support 40.78, resistance 42.84. technical analysis of uob stock. UOB Stock Analysis — full…

United Overseas Bank’s shares on SGX slipped to SGD 42.50 on 24 September 2026, down 0.79% from the previous close, but the move sits inside a broader pattern of quiet strength rather than outright weakness. The stock is still trading above both its short-term and medium-term moving averages, and the chart shows a market that has been grinding sideways with a mild upward tilt, not breaking down. That matters because for a bank stock like UOB, the message from the tape is often less about one day’s price change and more about whether buyers keep showing up on dips.
Trend & Price Action
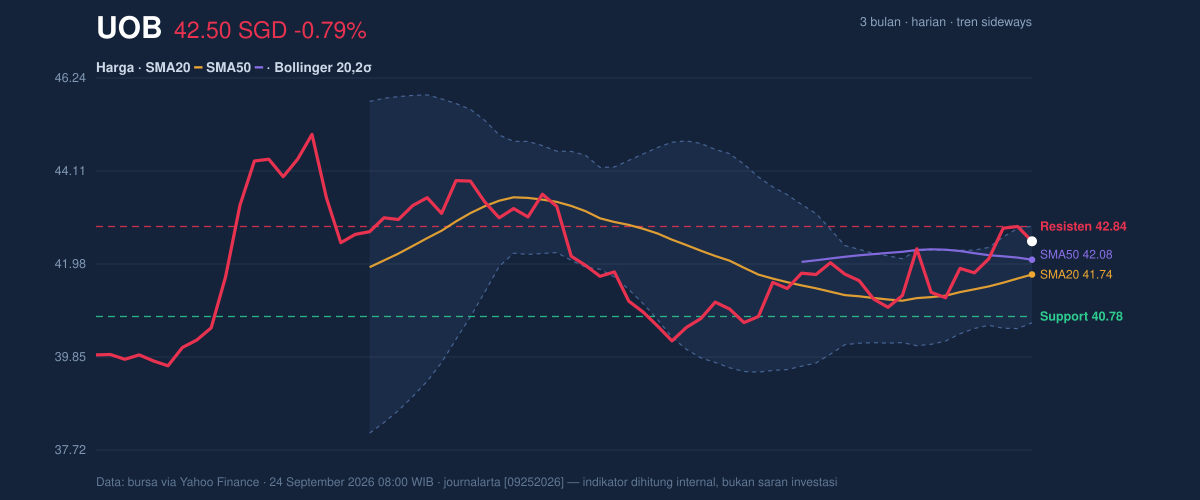
UOB remains in a sideways trend, but the slope of the SMA20 at 0.97% over 5 days suggests the short-term base is still leaning higher. The share price is holding above the SMA20 at 41.74 and the SMA50 at 42.08, which tells us the market is not treating recent weakness as a trend break. In plain terms, the stock is trading above the averages that many investors watch for direction, so the burden is on sellers to prove the move lower is more than noise.
The chart also shows UOB sitting near the upper part of its recent range, with price at 83% of the 20-hour range. That positioning is important: it means the stock is closer to resistance than support, so upside needs fresh demand to extend rather than just drift. The 3-month high of 45.15 remains the next obvious ceiling, while the 3-month low of 39.42 marks the lower boundary of the broader range.
Oscillators & Momentum
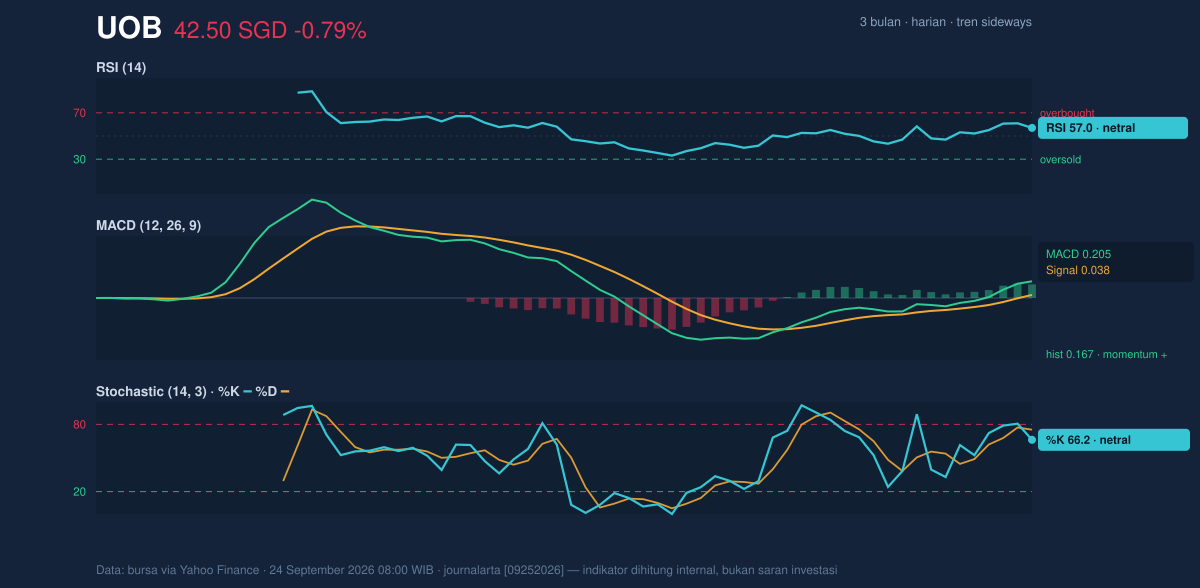
The momentum picture is constructive, but not stretched. RSI at 57.0 is neutral, which suggests the stock is neither overbought nor oversold and still has room to move without immediately running into exhaustion. The Stochastic %K at 66.2 and %D at 75.2 also sit in neutral territory, though the %K below %D hints that near-term upside may need a fresh push before momentum fully reasserts itself.
The cleaner signal comes from MACD at 0.205, above its signal line at 0.038, with a histogram of 0.167. That configuration means short-term momentum is still positive: the faster trend measure is above the slower one, and the gap between them remains supportive. In practical terms, the stock is not flashing a reversal warning; it is more consistent with a market consolidating after a modest climb.
Volatility & Volume
Bollinger Bands are telling the most interesting part of the story. The price sits near the upper band, with %B at 84%, which means UOB is trading in the upper portion of its recent volatility envelope. At the same time, the band width is only 5.3%, described as a squeeze. That combination often signals compression before expansion: the stock has been tightening, and a sharper move may follow once it escapes the range. The key point is not that a breakout is guaranteed, but that the market is storing energy rather than releasing it.
Volume, however, has not yet confirmed a decisive move. The latest turnover was 2,810,700, below the 20-day average of 3,121,158, or about 0.9x normal. That means the recent price action has not been powered by unusually heavy participation. Still, OBV is rising, which suggests that despite lighter day-to-day volume, the balance of trading has been gradually favoring accumulation over distribution. In simple terms, buyers have been more persistent than the raw volume figure alone might imply.
ATR at 0.73, or 1.7% of price, points to moderate volatility. That fits the broader picture: UOB is not swinging wildly, but the current squeeze means the next meaningful move could arrive with more conviction than the recent daily drift suggests.
Key Levels & Scenarios
The immediate battleground is clear on the chart. Resistance at 42.84 is effectively the near-term lid, while support at 40.78 is the first level where buyers have recently shown up. Since the share price closed just under resistance and above both moving averages, the market is balanced but slightly constructive.
If UOB can move through 42.84 with better participation, the squeeze setup and positive MACD would support a continuation toward the upper part of the recent range. If it fails to hold 41.74, the SMA20, the tone would shift from consolidation to a more cautious pullback. A break below 40.78 would matter more because it would place price back toward the lower side of the recent range and weaken the current pattern of higher short-term support.
Technical Verdict: HOLD (wait & see)
HOLD (wait & see) is the cleanest reading because the stock is constructive but not yet confirmed by volume or a breakout above resistance.
- MACD is positive, with the line above signal and a positive histogram, which supports underlying momentum.
- Price is above SMA20 and SMA50, so the medium-term structure remains intact.
- Bollinger Bands are in a squeeze, meaning the stock may be preparing for a larger move, but the direction is not confirmed yet.
- Verdict invalidated if price falls below 40.78, which would weaken the current support structure.
- Ideal Entry Range: 41.74 to 42.08
- Exit Target: 42.84, then the broader 45.15 range high if momentum expands
- Stop Loss protection: 40.78
For non-traders, this means UOB looks steady and slightly positive, but the market still needs a clearer push before the next move is proven.
Summary Data UOB
| Last price | 42.50 SGD |
| Change 1 day / 5 days / 1 month | -0.79% / 1.48% / 4.58% |
| Trend / MA-cross | sideways / none |
| SMA20 / SMA50 | 41.74 / 42.08 |
| RSI (14) / Stochastic %K | 57.0 / 66.2 |
| Bollinger %B / ATR | 84% / 0.73 |
| Support / Resistance 20 days | 40.78 / 42.84 |
| Data as of | 24 September 2026 08:00 WIB |



