AIA Stock Gains 0.60% Today, Testing Support Level
On September 25, 2026: price 75.80 HKD, trend sideways, RSI 49.3, support 75.05, resistance 77.50. technical analysis of aia stock. AIA Stock Gains — full…

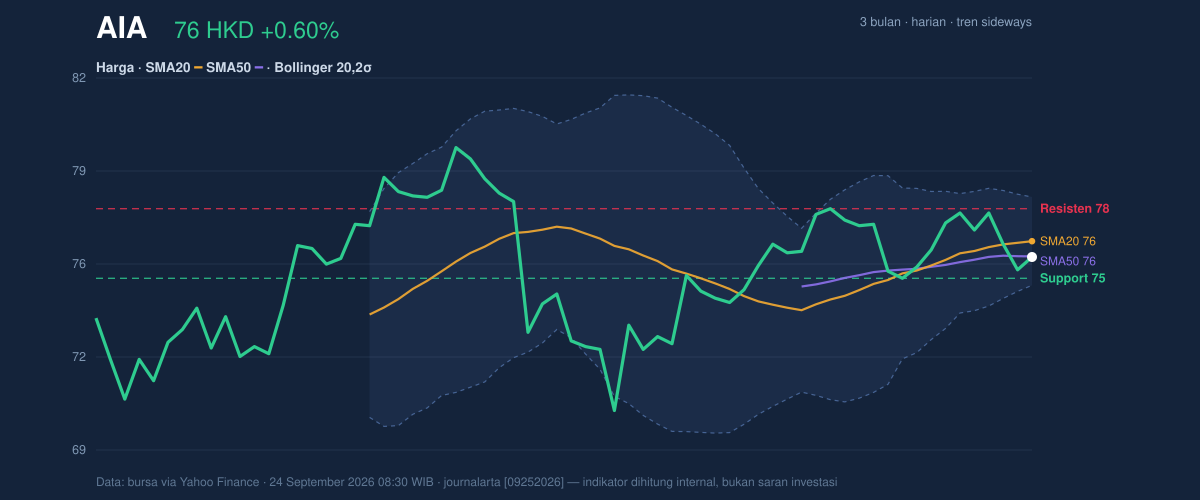
AIA Group’s shares finished at HKD 75.80, up 0.60% on the day, but the move sits inside a broader pause rather than a fresh trend. The stock is still trading below its SMA20 at 76.36 and just above the SMA50 at 75.82, which puts it in a narrow technical pocket: not weak enough to signal breakdown, but not strong enough to confirm a clean recovery. As shown in the chart, the price is also sitting in the lower part of its recent band, with the market trading at about 31% of the 20-hour range and well short of the 20-hour resistance at 77.50. That positioning matters because it suggests buyers have not yet regained control, even after a daily gain.
Trend & Price Action
The chart shows a stock that is still sideways, with the SMA20 slope at 0.56% over 5 days pointing to mild stabilization rather than acceleration. In plain terms, the short-term average is rising, but only gently; that usually means traders are testing the waters rather than committing capital aggressively. The lack of a new MA-cross reinforces that reading. A fresh moving-average crossover often marks a shift in trend direction, but here there is no such signal, so the market remains in a holding pattern.
The distance between the current price and the Bollinger middle band at 76.36 also matters. Prices below the midline often imply the stock is still working through overhead supply, even if the downside is not severe. The broader structure is still bounded by the 3-month high at 80.15 and the 3-month low at 69.35, which frames the recent trading as a mid-range consolidation rather than a decisive breakout or breakdown.
Oscillators & Momentum
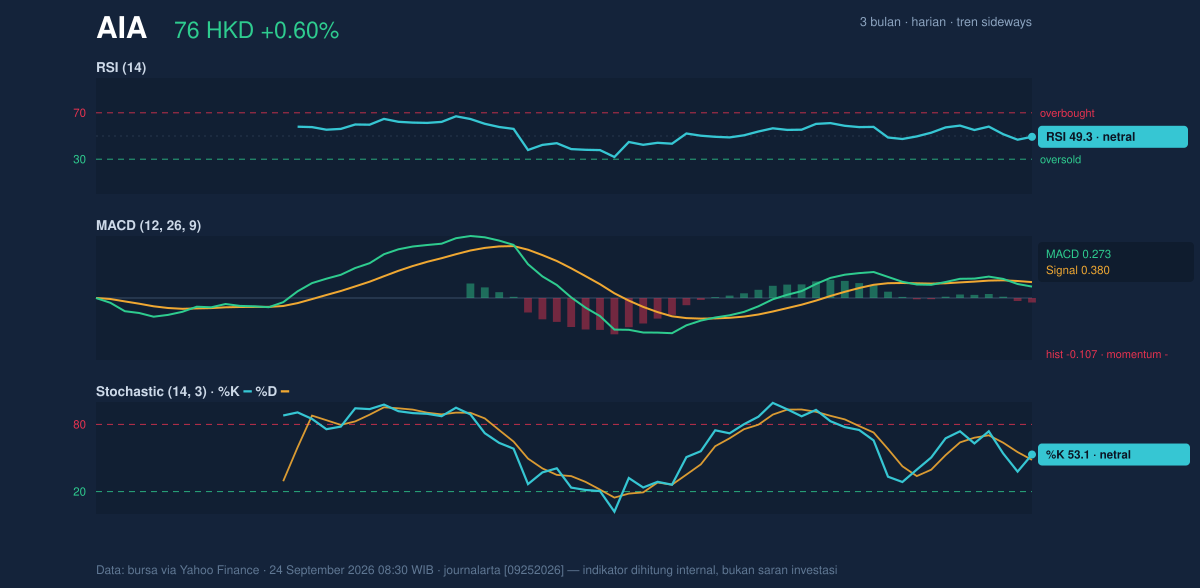
The momentum picture is mixed, and that is the most important signal in the chart. The RSI(14) at 49.3 is neutral, which means the stock is neither stretched upward nor washed out downward. The Stochastic %K at 53.1 and %D at 48.3 are also neutral, but with %K slightly above %D, short-term momentum is trying to improve. That said, improvement is not the same as confirmation.
The more cautionary reading comes from the MACD at 0.273 versus the signal line at 0.380, leaving a histogram of -0.107. This negative histogram means the faster trend line is still below the slower signal line, a classic sign that upside momentum has not fully taken hold. In simple language, the stock can bounce, but the chart is not yet showing the kind of momentum alignment that usually supports a sustained advance.
Volatility & Volume
Volatility is moderate, but the band structure is more interesting than the ATR reading alone. The ATR(14) at 1.58, or 2.1% of price, suggests normal day-to-day movement rather than a disorderly tape. More importantly, the Bollinger Bands are narrowing, with band width at 4.1%. A squeeze often signals that the market is storing energy for a larger move, but it does not tell direction by itself. In this case, the squeeze is happening while price sits below the middle band, which leans slightly bearish until buyers can push the stock back above the center line and toward the upper band at 77.91.
Volume adds a useful nuance. Last volume came in at 18,453,366, only 0.7× the 20-hour average of 26,259,498. That means the day’s advance did not arrive with strong participation, so the move lacks conviction. Still, OBV is rising, which suggests accumulation is building underneath the surface even if the latest trade flow was thin. That divergence is worth watching: price alone looks hesitant, but cumulative volume flow is not deteriorating.
Key Levels & Scenarios
The nearest technical floor is 75.05, the 20-hour support. That level is important because it sits just below the current price and close to the SMA50 at 75.82, creating a narrow buffer where the market is trying to stabilize. If that support fails, the chart opens room toward the lower Bollinger band at 74.80, which is the next obvious area where dip buyers may reappear.
On the upside, the first obstacle is 77.50, the 20-hour resistance. A move through that level would also put the stock closer to the upper Bollinger band at 77.91, where short-term rallies often face friction. Because the bands are squeezing, a break beyond that area could be more meaningful than usual; tight bands often precede sharper price expansion. But until that happens, the stock remains range-bound.
Technical Verdict: HOLD (wait & see)
- RSI at 49.3 and Stochastic at 53.1/48.3 are neutral, so momentum does not yet support a decisive directional call.
- MACD histogram at -0.107 shows momentum is still slightly negative, even as the broader trend is sideways.
- Bollinger Bands are squeezing, which raises the chance of a sharper move, but direction remains unconfirmed while price sits below SMA20 at 76.36.
- Verdict invalidated if price falls below 75.05, because that would break the nearest support and weaken the current base.
- Ideal Entry Range: 75.05 to 75.82
- Exit Target (Target Price): 77.50 to 77.91
- Stop Loss protection: below 74.80
In plain English, the stock is not showing enough trend strength yet, so the chart says wait for confirmation rather than assuming the next move.
Summary Data AIA
| Last price | 75.80 HKD |
| Change 1 day / 5 days / 1 month | 0.60% / -2.00% / 1.54% |
| Trend / MA-cross | sideways / none |
| SMA20 / SMA50 | 76.36 / 75.82 |
| RSI (14) / Stochastic %K | 49.3 / 53.1 |
| Bollinger %B / ATR | 32% / 1.58 |
| Support / Resistance 20 days | 75.05 / 77.50 |
| Data as of | 24 September 2026 08:30 WIB |


