Momentum Weakens, OCBC Stock Drops 0.19% Today
On September 25, 2026: price 31.59 SGD, trend uptrend, RSI 54.8, support 31.00, resistance 32.27. technical analysis of ocbc stock. Momentum Weakens — full…

OCBC Bank ended the latest session at SGD 31.59, down 0.19% from the previous close of SGD 31.65, but the softer finish does not change the broader setup: the shares remain in an uptrend and are still trading above the SMA20 at 31.58 and well above the SMA50 at 30.63. That matters because it shows the stock is not merely bouncing inside a range; it is holding above both short- and medium-term trend lines, with the 20-day average still rising at 0.43% over five days. As shown in the chart, the price is sitting near the middle of its recent band rather than pressing either extreme, which usually signals a market that is still constructive but waiting for fresh confirmation.
Trend & Price Action
The price structure remains orderly. OCBC is trading just above the SMA20, which often acts as a short-term balance point between buyers and sellers, while the gap to the SMA50 suggests the longer trend is still intact. There is no new MA-cross, so the chart is not flashing a fresh trend change; instead, it is showing continuity. That is important because a lack of crossover after a sustained move often means the market is pausing rather than reversing.
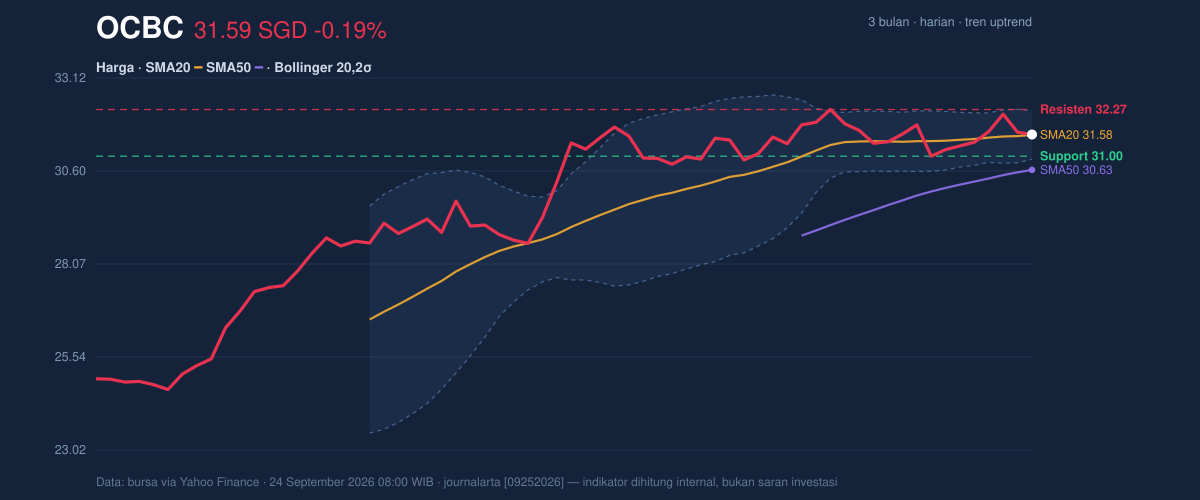
The stock is also trading in the upper half of its recent range, with the price at about 46% of the 20-hour range between support at 31.00 and resistance at 32.27. In plain terms, the market has room to move either way, but it is not under immediate pressure. The 3-month high at 32.57 sits just above the current resistance zone, so a clean push through 32.27 would place the shares close to a fresh test of that ceiling; failure to hold above 31.00 would instead shift attention back toward the lower end of the recent structure.
Oscillators & Momentum
The momentum tools are more mixed than the trend lines. RSI at 54.8 is neutral, which means the stock is neither stretched nor oversold. That is a healthy reading for an uptrend because it suggests there is still purchasing capacity left if a catalyst arrives. The Stochastic %K at 50.4 and %D at 55.2 are also neutral, showing neither an overbought surge nor an oversold washout. In other words, the market is not screaming “reversal” from the oscillator side.
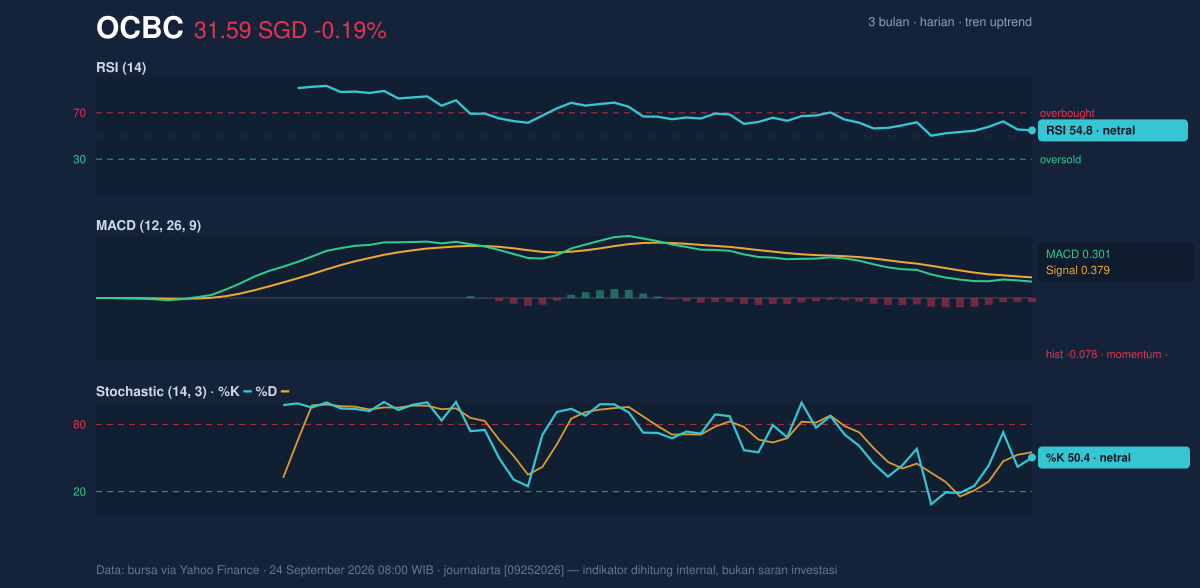
The more cautious signal comes from MACD at 0.301, which is below the signal line at 0.379, leaving a -0.078 histogram. That configuration means short-term momentum has slipped under the smoother trend gauge, even though the broader price trend remains positive. This is not a bearish breakdown by itself, but it does tell investors that the latest advance has lost some pace. When MACD turns negative while price still sits above the moving averages, the usual message is that the trend is intact but needs renewed buying to accelerate again.
Volatility & Volume
Volatility is moderate. The ATR at 0.48, or 1.5% of price, implies daily swings are present but not disorderly. More telling is the Bollinger setup: the band width has narrowed to 4.2%, and the chart shows a squeeze. That matters because squeezes often precede expansion, not because direction is guaranteed, but because compressed ranges tend to resolve into a sharper move. With %B at 51%, price is sitting close to the center of the bands rather than leaning against the upper or lower edge, reinforcing the view that the stock is coiling rather than breaking.
Volume adds a useful wrinkle. The latest turnover of 4,574,300 is only 0.8 times the 20-day average of 5,922,822, so the market has not yet shown strong participation in the latest move. But OBV is rising, which suggests the underlying flow of volume has still been supportive over time. That combination — lighter day-to-day volume, but improving cumulative volume pressure — often points to consolidation rather than distribution. It is a sign that sellers have not seized control, even if buyers have not yet committed aggressively.
Key Levels & Scenarios
The immediate map is fairly clear. 31.00 is the first level that matters on the downside, because it marks the 20-hour support and sits close to the lower edge of the recent range. If that floor holds, the chart can remain in consolidation within an uptrend. If it fails, the market would be signaling that the current base is weaker than it looks.
On the upside, 32.27 is the first resistance to watch, just below the 3-month high at 32.57. A move through 32.27 would indicate that the squeeze is resolving upward and that the stock is attempting to retest the recent peak. If price stalls below that area while MACD stays below signal, the message would be that momentum is improving only slowly.
Technical Verdict: HOLD (wait & see)
HOLD (wait & see)
- Price is still above the SMA20 and SMA50, so the broader trend remains constructive.
- MACD is negative versus the signal line, showing momentum has softened even though the trend has not broken.
- Bollinger Bands are squeezed, which often precedes a directional move, but not necessarily an immediate one.
Verdict invalidated if price falls below 31.00.
- Ideal Entry Range: 31.00 to 31.58
- Exit Target: 32.27 to 32.57
- Stop Loss protection: below 31.00
In plain English, the shares still look technically healthy, but the next decisive move has not arrived yet.
Summary Data OCBC
| Last price | 31.59 SGD |
| Change 1 day / 5 days / 1 month | -0.19% / 0.99% / 2.23% |
| Trend / MA-cross | uptrend / none |
| SMA20 / SMA50 | 31.58 / 30.63 |
| RSI (14) / Stochastic %K | 54.8 / 50.4 |
| Bollinger %B / ATR | 51% / 0.48 |
| Support / Resistance 20 days | 31.00 / 32.27 |
| Data as of | 24 September 2026 08:00 WIB |


