Testing Support Level, UOB Stock Drops 5.16% on Thursday
On October 8, 2026: price 40.25 SGD, trend sideways, RSI 35.7, support 40.25, resistance 43.72. technical analysis of uob stock. Testing Support Level — full…
Trend & Price Action
UOB’s latest close was below both its 20-day simple moving average (SMA), at S$42.40, and its 50-day SMA, at S$42.01. A simple moving average tracks the average closing price over a set period; trading below both suggests recent weakness, though the data show no new crossover between the two averages. The broader trend is classified as sideways, with the 20-day SMA still slightly rising over the past five sessions. That combination signals a sharp short-term break within a market structure that has not yet established a sustained downward trend. The shares fell 7.13% over five sessions and 1.81% over a month. At S$40.25, UOB was at the bottom of its 20-day trading range and close to its three-month low of S$39.80. The latest price also sat below the lower Bollinger Band, S$40.67. Bollinger Bands frame a stock’s recent price variation; slipping beneath the lower band can mark unusually intense selling, but it does not by itself confirm a reversal. The band width of 8.2% remains normal, rather than showing the pronounced narrowing associated with a volatility squeeze. As shown in the chart, the gap between the last price and the moving averages makes the recent deterioration visible against the still-sideways broader trend.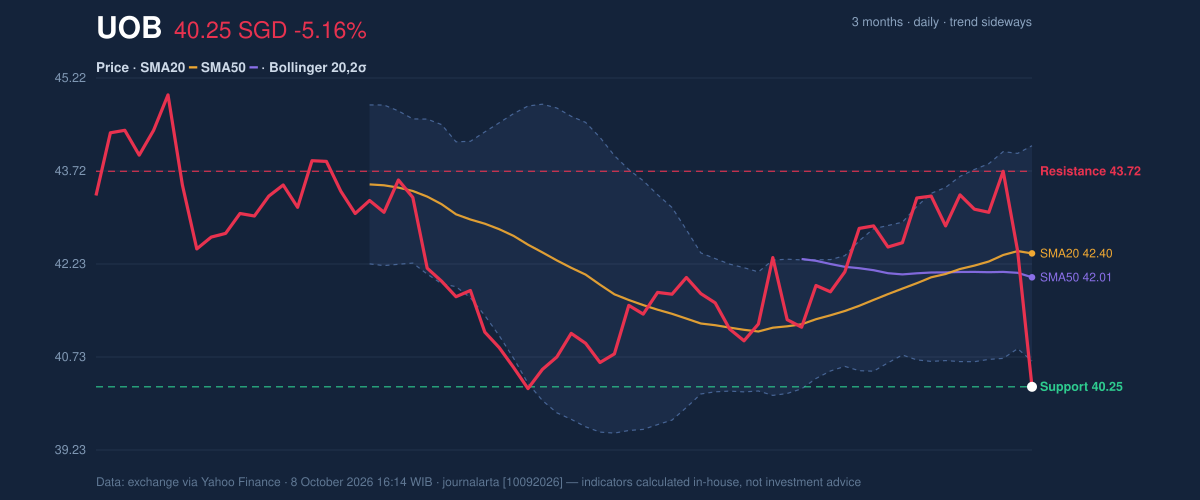
Oscillators & Momentum
The momentum readings are weak, but they do not all say the same thing. RSI, a gauge of recent upward versus downward price momentum, stood at 35.7, in neutral territory. That is soft, but not enough to establish an oversold reading on its own. The Stochastic oscillator, which compares the latest close with the recent trading range, told a more extreme story: %K was 1.4 against %D at 48.3, a deeply oversold configuration. Oversold conditions can precede a rebound, but in a sharp decline they can also persist while selling continues. The MACD gives the clearest confirmation of deterioration. Its histogram was negative at -0.150, with the MACD line at 0.126 below its signal line at 0.276. In plain terms, recent momentum has weakened enough for the shorter-term trend measure to fall beneath its smoother comparison line. That shift, together with the volume surge, makes the move more consequential than the oversold Stochastic reading alone might suggest. The momentum chart helps distinguish the possible early-rebound signal in the Stochastic reading from the broader weakness shown by MACD.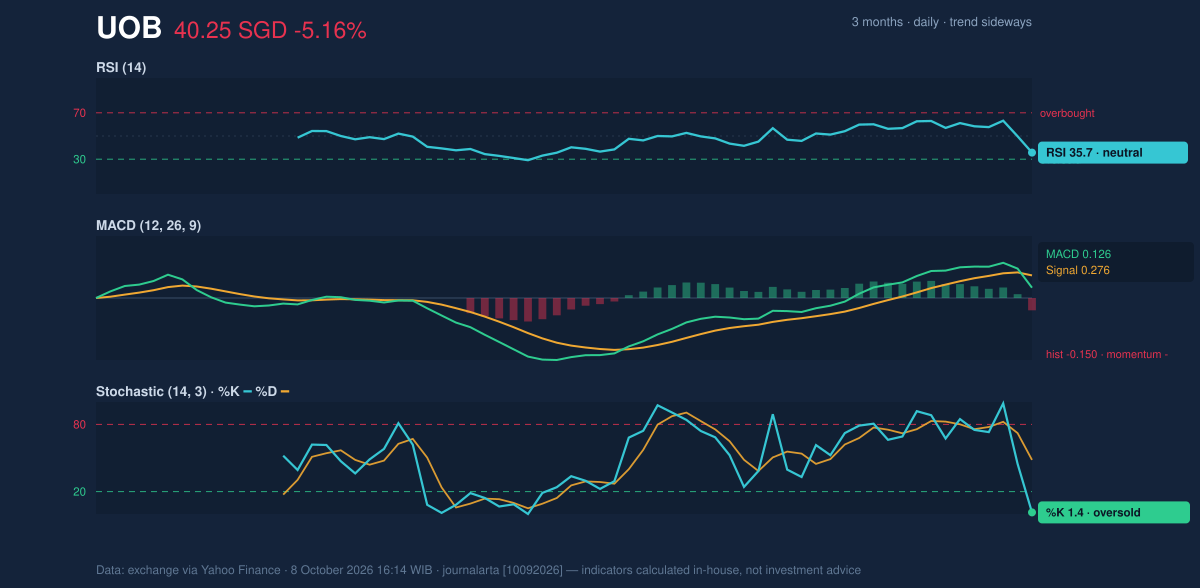
Volatility, Volume & Key Levels
Volume reached 8,778,990 shares, or 2.1 times the 20-day average of 4,196,182. A high-volume fall generally indicates wider participation in the sell-off; here, declining OBV—the running measure of volume flowing into or out of a stock—also points to selling pressure rather than accumulation. Average true range (ATR), a measure of typical price movement, was S$0.98, or 2.4% of the share price. That indicates moderate usual volatility, while the latest drop was unusually large relative to that baseline. The immediate reference points are S$40.25 support and S$43.72 resistance, the 20-day range’s low and upper boundary in the supplied data. A sustained hold around support could allow the oversold Stochastic reading to matter; a break below it would put the three-month low of S$39.80 in focus. A recovery through resistance would show that buyers had reclaimed a meaningful part of the recent decline, though the S$42.01–S$42.40 moving-average zone would remain an intervening test.Technical Verdict: HOLD (wait & see)
HOLD (wait & see) reflects the conflict between a deeply oversold Stochastic reading and evidence of active selling: the MACD histogram is negative, OBV is falling, and the closing price is below both moving averages. The heavy volume accompanying the decline argues against treating oversold conditions as confirmation of a bottom. The verdict is invalidated if the price breaks below S$39.80, the three-month low.- Ideal entry range: S$39.80–S$40.67, spanning the three-month low and lower Bollinger Band; this is a technical reference range, not a signal that a rebound is confirmed.
- Exit target (target price): S$43.72, the stated 20-day resistance.
- Stop-loss protection: Below S$39.80, where a break would undermine the support case.
Data source: SGX market data via Yahoo Finance, as of October 8, 2026, 16:14 WIB.
Why UOB is in focus today
- One-day move of -5.16%, about 2.1× its average daily range (ATR)
- Volume at 2.1× the 20-day average
- Closed at a 20-day low (40.25)
- Trading near its 3-month low (39.80)
- MACD histogram has just turned negative
Selected automatically from 16 SGX (Singapore) stocks by a technical-signal score with daily weighted randomisation — not a recommendation.
Summary Data UOB
| Last price | 40.25 SGD |
| Change 1 day / 5 days / 1 month | -5.16% / -7.13% / -1.81% |
| Trend / MA-cross | sideways / none |
| SMA20 / SMA50 | 42.40 / 42.01 |
| RSI (14) / Stochastic %K | 35.7 / 1.4 |
| Bollinger %B / ATR | -12% / 0.98 |
| Support / Resistance 20 days | 40.25 / 43.72 |
| Data as of | 8 October 2026 16:14 WIB |
Disclaimer: This technical analysis is generated automatically from exchange data (via Yahoo Finance) and indicators calculated by JournalArta, for information and education only. The verdict and the entry, target and stop-loss levels are not investment advice or a solicitation to buy or sell any security. Investment decisions and their risks rest solely with the reader.
Track UOB share price daily: live levels, support/resistance and our full UOB analysis history.