HSBC Stock Analysis: Gains 0.45%, Death Cross Pressure
On September 28, 2026: price 157.60 HKD, trend downtrend, RSI 40.9, support 156.90, resistance 167.60. technical analysis of hsbc stock.

At HKEX on 25 September 2026, HSBC Holdings’ shares were changing hands at HKD 157.60, a modest 0.45% rise on the day, but still sitting below both its short- and medium-term averages. The number that matters most is not the daily gain, but the stock’s position: it remains under the SMA20 at HKD 162.13 and SMA50 at HKD 162.16, with the chart showing a death cross — the point where the 20-day average drops below the 50-day average — a signal that often reflects weakening trend structure rather than a one-day rebound. In plain terms, the market is still trading as if sellers have the upper hand, even though the latest session nudged higher.
Trend & Price Action
The wider setup remains fragile. HSBC is in a downtrend, and the slope of the SMA20 is -0.45% over 5 days, which means the recent average price itself is still drifting lower. That matters because moving averages are not just lines on a chart; they show whether buyers are consistently willing to pay more over time. Here, the answer is no. The share price is also below the middle Bollinger band at HKD 162.13, which reinforces that the stock is trading below its recent “fair value” zone as defined by the 20-day average.
The chart also places the price in the lower part of its recent range. The 20-day support is HKD 156.90 and the 20-day resistance is HKD 167.60, while the 3-month range runs from HKD 145.40 to HKD 169.70. That means the stock is now only slightly above immediate support and still well below the upper end of the broader range. The message is simple: the market has not yet proved it can reclaim lost ground.
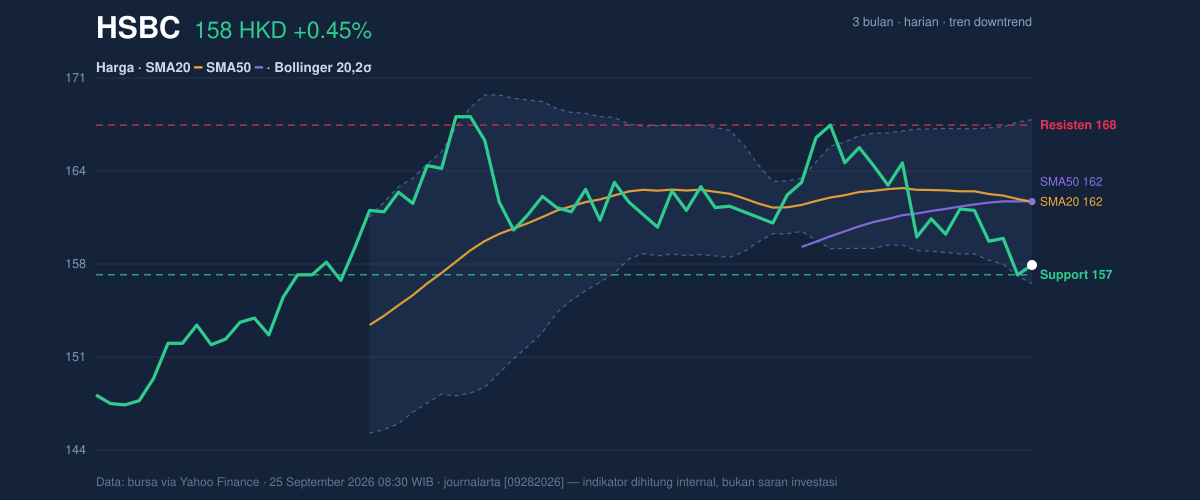
The latest close is also sitting just above the lower Bollinger band at HKD 156.27. That is important because it shows the price is pressing the lower edge of its recent volatility envelope, often a sign of stress — but also a zone where short-term bounces can appear if selling pressure eases. The key point is that being near the lower band does not automatically mean a reversal; it only means the stock is stretched to the downside relative to its recent trading range.
A small bounce does not erase a weak trend.
Oscillators & Momentum
Momentum signals are mixed, but not in a way that yet confirms a durable recovery. The RSI at 40.9 is neutral, which tells us the stock is neither deeply oversold nor overbought. That is a useful reading because it suggests there is still room for either direction, but it does not provide a strong bullish trigger on its own. The more important short-term signal comes from the Stochastic oscillator: %K 16.8 and %D 12.9, which is in oversold territory. Oversold means the stock has fallen fast enough that near-term downside may be getting tired — but oversold can persist in a downtrend, so it is a warning light rather than a reversal guarantee.
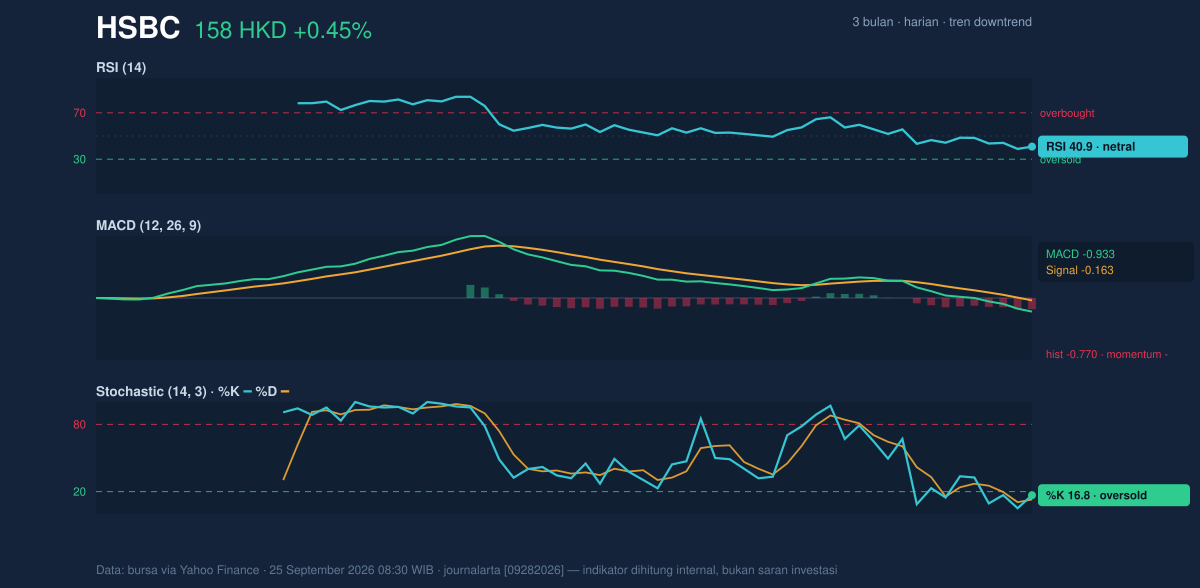
The strongest momentum clue is still the MACD at -0.933, below its signal line at -0.163, with a histogram of -0.770. MACD is a trend-following momentum measure, and when it stays below the signal line, it usually indicates that downside momentum remains dominant. The negative histogram shows that the gap between the two lines is still meaningfully bearish. In practical terms, the stock may be oversold on the stochastic, but the broader momentum engine has not yet turned.
That split matters. Oversold oscillators can hint at a bounce, while a negative MACD says the larger move is still pointing lower. When those two disagree, the market is usually in a transitional phase — not a clean trend reversal.
Volatility & Volume
Volatility is present, but not extreme. The ATR(14) is 2.75, or 1.7% of price, which suggests a normal-to-moderate daily swing for a stock of this size. ATR, or average true range, is a measure of how much the share typically moves in a day; here it implies the stock can still travel meaningfully without a major catalyst. More interesting is the Bollinger band width at 7.2%, described as a squeeze. A squeeze means the bands have narrowed, often indicating that a larger move may be building. The direction of that move is not guaranteed, but squeezes usually precede expansion rather than calm.
Volume, however, does not yet support a bullish interpretation. Last traded volume was 6,560,612, well below the 20-day average of 10,498,732, or 0.6x normal. That tells us the latest uptick was not backed by broad participation. The OBV is falling, which is a further caution sign: on-balance volume tracks whether money is flowing into or out of the stock, and a declining OBV suggests accumulation has not returned in a convincing way. Put simply, the share price may be trying to stabilize, but the crowd is not yet showing up behind it.
The rebound is light on conviction.
Key Levels & Scenarios
The immediate battleground is clear. HKD 156.90 is the key nearby support, and the latest price at HKD 157.60 is only marginally above it. A failure to hold that zone would put the lower Bollinger band at HKD 156.27 in focus, and a break below that area would suggest the market is resuming downside pressure rather than building a base. On the upside, HKD 162.13 and HKD 162.16 are the first technical hurdles because they combine the middle moving average and the short-term trend reference. Above that, HKD 167.60 is the next resistance, and only then does the stock begin to challenge the upper part of its range near HKD 169.70.
The chart is therefore not telling a story of a fresh trend change; it is telling a story of a stock trying to stop falling. Whether that effort succeeds depends on whether price can regain the moving averages and whether volume returns with conviction.
Technical Verdict: HOLD (wait & see)
HOLD (wait & see)
- Reason 1: Death cross + price below SMA20/SMA50 — the trend structure remains bearish until HSBC can reclaim the HKD 162.13–162.16 area.
- Reason 2: MACD remains negative — momentum is still below the signal line, showing downside pressure has not fully faded.
- Reason 3: Stochastic is oversold but volume is weak — the stock may be stretched, yet 0.6x normal volume and falling OBV do not confirm accumulation.
- Verdict invalidated if price breaks below HKD 156.90.
- Ideal Entry Range: HKD 156.90 to HKD 162.13, only if price stabilizes and begins reclaiming the middle band/SMA20 area.
- Exit Target: HKD 167.60, with a stretch reference toward HKD 169.70 if resistance is cleared.
- Stop Loss protection: Below HKD 156.27, with the 20-day support at HKD 156.90 as the first line of defense.
For non-traders, this means the stock is not showing enough strength for a clean bullish technical signal, but it is also not weak enough to call a breakdown yet.
The latest 3-month high is HKD 169.70 and the latest 3-month low is HKD 145.40.
Summary Data HSBC
| Last price | 157.60 HKD |
| Change 1 day / 5 days / 1 month | 0.45% / -2.48% / -2.35% |
| Trend / MA-cross | downtrend / death |
| SMA20 / SMA50 | 162.13 / 162.16 |
| RSI (14) / Stochastic %K | 40.9 / 16.8 |
| Bollinger %B / ATR | 11% / 2.75 |
| Support / Resistance 20 days | 156.90 / 167.60 |
| Data as of | 25 September 2026 08:30 WIB |


