AstraZeneca Stock Analysis: Gains 1.18%, Momentum Weakens
On Agustus 11, 2026: price 11,990.00 GBp, trend downtrend, RSI 37.7, support 11,500.00, resistance 13,134.00. technical analysis of astrazeneca stock.

Trading on the London Stock Exchange showed AstraZeneca at 11,990.00 GBp on 7 August 2026 at 14:00 WIB, up 1.18% on the day after a weaker stretch that left the shares 5.08% lower over five days and 6.58% down over one month. The move matters less as a one-day bounce than as a test of whether buyers can defend a stock that is still trading below its short- and medium-term trend lines, even as volume and on-balance volume suggest some participation is returning.
Trend & Price Action
As shown in the chart, AstraZeneca remains in a clear downtrend, with the SMA20 at 12,451.50 and the SMA50 at 13,197.96 both sitting above the current price. That positioning tells readers the shares are still trading under the market’s recent average and the broader two-month average, which is usually a sign that rallies have not yet changed the underlying direction.
The slope of the SMA20 at -3.81% over five days is the more important signal. A falling short-term average means the recent trend is still leaning lower, so any bounce is being measured against a declining baseline rather than a stable floor. There is also no fresh MA-cross, which matters because a new moving-average crossover is often the first technical sign that trend momentum is shifting. Its absence suggests the chart has not yet produced that kind of confirmation.
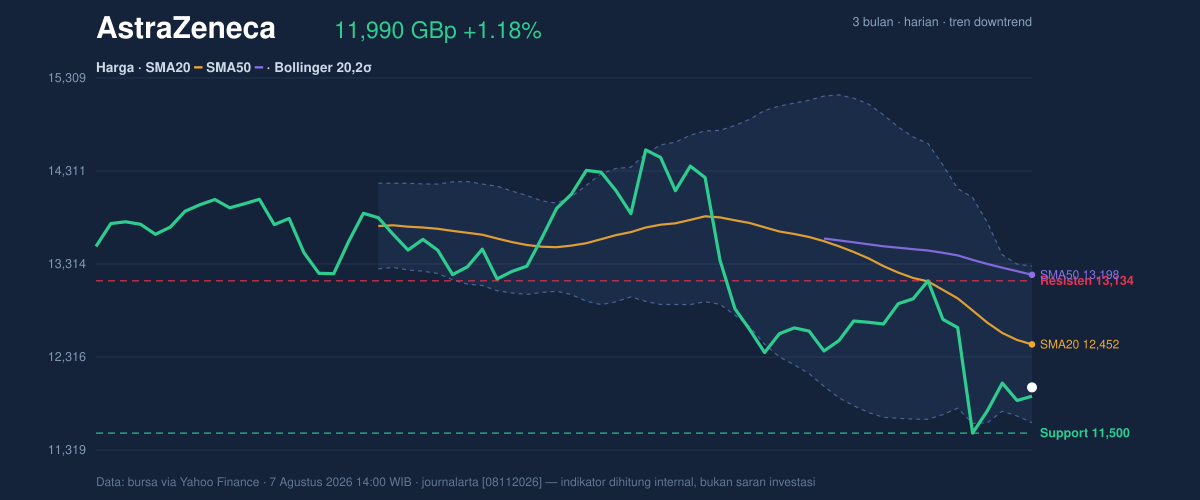
Price is also sitting at 30% of the 20-day range, with support at 11,500.00 and resistance at 13,134.00. That placement is closer to the lower end of the range than the middle, which implies the market is still treating rebounds cautiously. The shares are not at the 3-month low of 9,892.00, but they are well below the 3-month high of 15,126.00, leaving a wide gap that only a sustained recovery in trend would begin to close.
Oscillators & Momentum
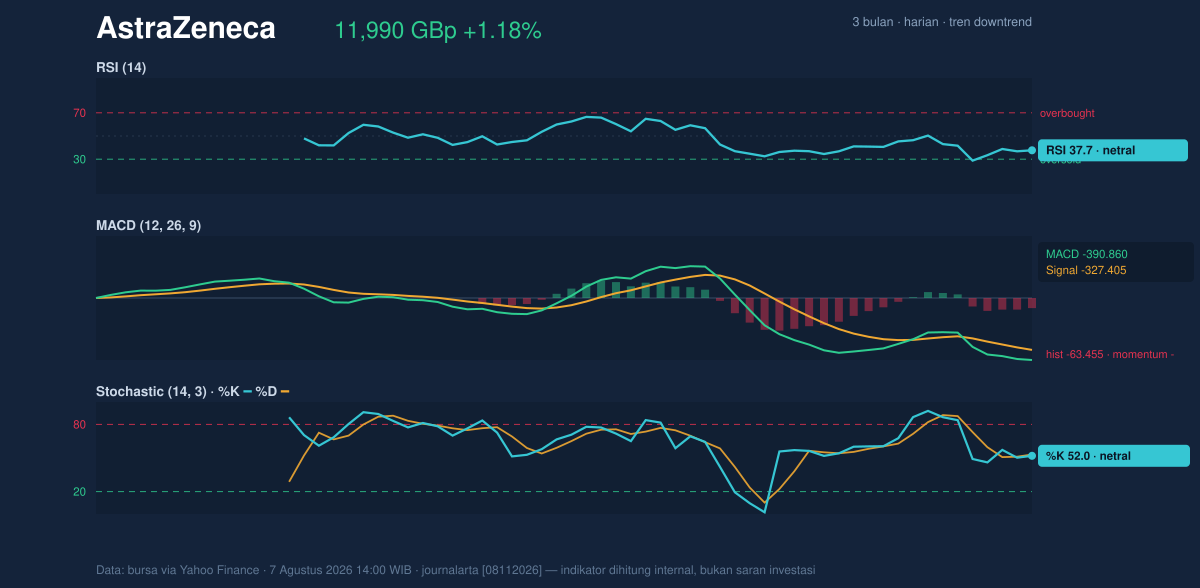
The oscillator picture is mixed, but not in a way that yet signals a clean reversal. The RSI(14) at 37.7 is neutral, though it sits below the midpoint that traders often read as a dividing line between stronger and weaker momentum. In plain language, that means the shares are not washed out enough to scream oversold, but they are still carrying the weight of recent selling.
The Stochastic %K at 52.0 and %D at 53.2 is also neutral, which points to a market that is neither stretched on the upside nor deeply depressed. That neutrality matters because it leaves room for either a continuation of the bounce or another leg lower, depending on whether price can hold support.
The sharper signal comes from MACD. With MACD at -390.860, the signal line at -327.405 and a histogram of -63.455, momentum is still negative. The histogram being below zero means the MACD line is still under the signal line, so the trend has not yet turned upward in a confirmed way. In practical terms, the chart is showing that the recent rebound has not yet beaten the broader bearish impulse.
Volatility & Volume
Bollinger Bands reinforce that cautious reading. The price sits near the lower band, with %B at 23%, while the band width is 13.5%, described here as normal. A low %B means the shares are trading in the lower part of their recent volatility envelope, which often reflects either bargain-hunting or ongoing pressure. Because the band width is not compressed, the market is not coiling for an obvious breakout; it is still capable of moving, and the ATR(14) at 538.79 — about 4.5% of price — shows that daily swings remain relatively large.
That volatility is being met by stronger participation. Volume reached 12,677,978, around 3.0× the 20-day average of 4,246,757, while OBV is rising. Rising OBV, or on-balance volume, means more volume has been associated with upward closes than downward ones. That is an encouraging sign, but it needs follow-through. Heavy volume on a downtrend can also mark active repositioning rather than a durable shift in ownership.
Key Levels & Scenarios
The nearest technical line in the sand is 11,500.00 support. If that level holds, the shares could continue to stabilise inside the current range and attempt a move back toward 12,451.50, the Bollinger middle and SMA20, which now acts as the first meaningful recovery zone. Above that, 13,134.00 resistance becomes the next test, and a break through it would show that the bounce is beginning to challenge the recent downtrend rather than merely reacting inside it.
If 11,500.00 fails, the chart would be leaning back toward the lower part of the broader 3-month range, with the 9,892.00 low back in view. That would also deepen the gap between price and the SMA50 at 13,197.96, making the trend damage harder to reverse.
Technical Verdict: HOLD (wait & see)
HOLD (wait & see) fits the chart best because the signals are split: MACD remains negative, price is below the SMA20 and SMA50, and the SMA20 slope is still falling; but volume is 3.0× average and OBV is rising, which hints at renewed interest. The verdict is invalidated if price falls below 11,500.00, because that would weaken the current support structure and reopen the route toward the 3-month low.
- Ideal Entry Range: 11,500.00 to 12,451.50
- Exit Target (Target Price): 12,451.50, then 13,134.00
- Stop Loss protection: below 11,500.00
In plain English: AstraZeneca is trying to steady itself, but the chart still needs proof that the bounce is more than a brief pause.
Volume last traded at 12,677,978 shares, versus a 20-day average of 4,246,757.
Summary Data AstraZeneca
| Last price | 11,990.00 GBp |
| Change 1 day / 5 days / 1 month | 1.18% / -5.08% / -6.58% |
| Trend / MA-cross | downtrend / none |
| SMA20 / SMA50 | 12,451.50 / 13,197.96 |
| RSI (14) / Stochastic %K | 37.7 / 52.0 |
| Bollinger %B / ATR | 23% / 538.79 |
| Support / Resistance 20 days | 11,500.00 / 13,134.00 |
| Data as of | 7 Agustus 2026 14:00 WIB |


