BP Stock Gains 0.94% Today, Momentum Weakens
On Agustus 11, 2026: price 524.60 GBp, trend sideways, RSI 47.9, support 505.00, resistance 555.90. technical analysis of bp stock. BP Stock Gains — full…

BP plc is trading in a technically mixed setup on the London market, with the shares recovering on the day but still sitting below the short-term average that often acts like a line of control for traders. BP last changed hands at 524.60 GBp, up 0.94% from the previous close of 519.70, yet the broader message from the chart is less upbeat than the one-day move suggests.
Trend & Price Action
The shares are still in a sideways trend, and that matters because sideways markets often punish both early optimism and premature pessimism. BP is trading below the SMA20 at 528.96 but above the SMA50 at 513.34, which puts the stock in a short-term pause rather than a clean uptrend. In plain language: the market has not committed to a fresh directional move.
There is no new MA-cross, so the moving averages are not giving a new trend signal. That absence is meaningful. A fresh cross would usually tell traders that momentum has shifted decisively; instead, BP remains in a holding pattern where price is hovering between the faster and slower averages.
The Bollinger Band structure reinforces that picture. The middle band at 528.96 sits just above the current price, while the lower band at 497.63 and upper band at 560.28 frame the likely technical range. With %B at 43%, price is below the midpoint of the band but far from the lower edge, suggesting BP is not stretched to the downside yet. The 11.8% band width is normal, so this is not a compression setup screaming for a breakout; it is more consistent with a market still digesting prior moves.
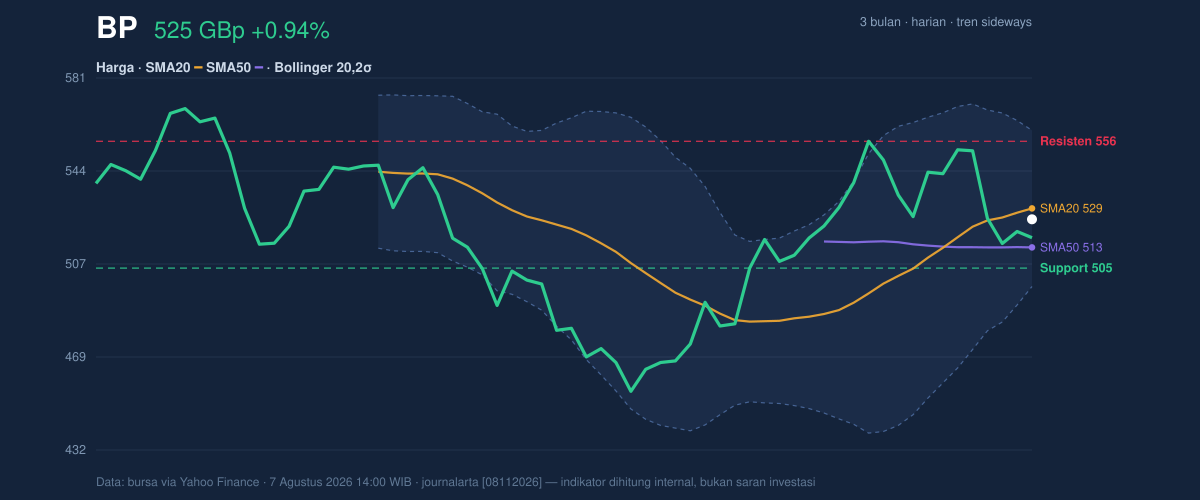
The chart also shows BP at 39% of its 20-day range between support at 505.00 and resistance at 555.90. That positioning is important: the stock is closer to support than resistance, but not close enough to call it a clean base. It is still within the lower half of the range, which keeps the burden of proof on the bulls.
Oscillators & Momentum
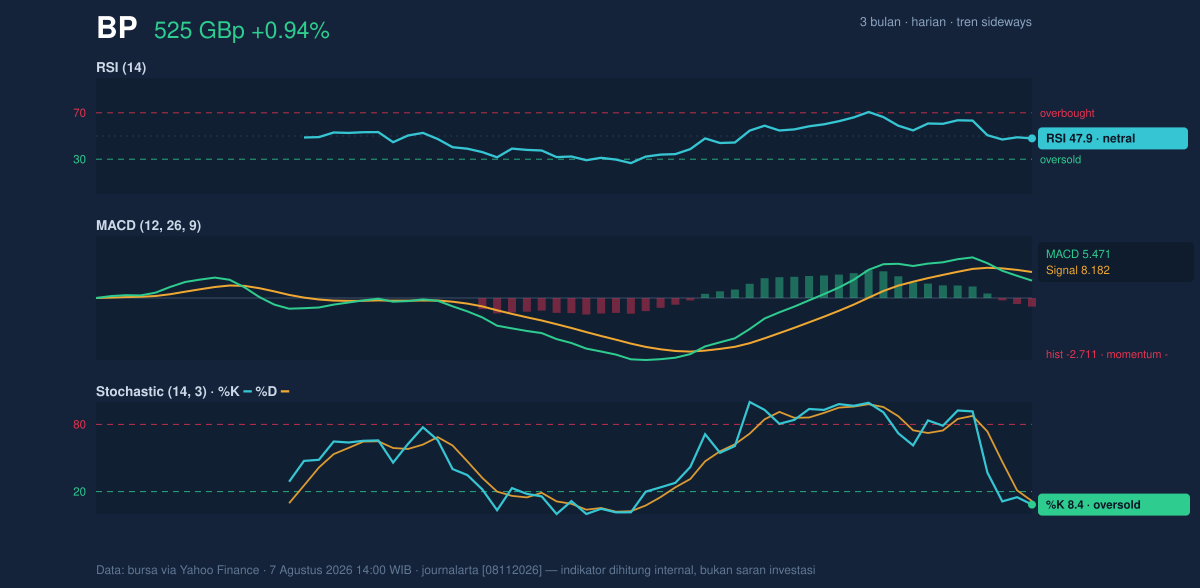
Momentum is where the story turns more cautious. The RSI at 47.9 is neutral, which means the market is neither overbought nor oversold on this measure. Neutral RSI often signals indecision: buyers are present, but they have not yet forced price into a stronger trend.
The Stochastic oscillator is oversold, with %K at 8.4 and %D at 11.6. That typically means short-term selling has gone far enough to leave the stock stretched. However, oversold does not automatically mean reversal; it only means the downside may be getting tired. For confirmation, traders usually want to see %K turn back above %D, which is not yet visible in the data.
The MACD is negative, with MACD at 5.471, signal at 8.182, and a histogram of -2.711. The histogram below zero tells us momentum is still leaning lower relative to the signal line. That is the clearest bearish element in the dataset: even though price rose on the day, the underlying momentum has not yet flipped back in favor of the move. In other words, the bounce is visible in price, but not yet fully confirmed by momentum.
Volatility & Volume
Volatility is moderate rather than explosive. The ATR(14) at 16.71, equal to 3.2% of price, suggests BP can move with reasonable daily swings, but not in a panic regime. That is useful context: the stock has room to travel, yet it is not currently signaling a disorderly break.
Volume is the most striking participation signal in the data. Last session volume was 129,847,104, compared with a 20-session average of 47,705,270, or 2.7× normal. That kind of surge matters because it shows the day’s price move was not happening in a vacuum. Heavy turnover often means institutions are active, but the OBV is falling, which tempers the interpretation. OBV, or on-balance volume, tracks whether volume is accumulating into up days or draining away on down days. A falling OBV alongside a price bounce suggests that selling pressure has not been fully washed out.
For readers watching the chart, the key point is this: volume confirms activity, but not yet conviction.
Key Levels & Scenarios
The immediate technical map is straightforward. Support sits at 505.00, and resistance is 555.90. Those are the levels that matter most in the near term because they bracket the current range and define whether BP is still trapped or beginning to escape.
If the shares hold above 505.00 and reclaim the SMA20 at 528.96, the chart would look healthier, especially if the Stochastic turns up from oversold and the MACD histogram starts to narrow. That would suggest the recent bounce is evolving into something more durable.
If price fails to hold 505.00, the lower Bollinger Band at 497.63 becomes the next technical reference, and the market would be signaling that the current range is breaking down rather than stabilizing.
The 3-month range adds context: BP has traded between a high of 575.70 and a low of 450.60. The current price is still well below the top of that range, so there is room to recover technically, but the market has not yet shown the momentum needed to challenge the upper end decisively.
Technical Verdict: HOLD (wait & see)
HOLD (wait & see)
- Reason 1: price is below the SMA20, so the short-term trend has not fully turned up.
- Reason 2: MACD remains negative and the histogram is below zero, showing momentum is still weak.
- Reason 3: Stochastic is oversold, which supports a rebound attempt, but not yet a confirmed reversal.
- Verdict invalidated if price breaks below 505.00, because that would weaken the current range floor and shift attention toward the lower Bollinger Band at 497.63.
- Ideal Entry Range: 505.00 to 528.96
- Exit Target (Target Price): 555.90
- Stop Loss protection: below 497.63
In plain English: BP is not flashing a clean trend signal yet, but it is close enough to support that traders will want to watch whether the next move is a rebound or another leg lower.
Summary Data BP
| Last price | 524.60 GBp |
| Change 1 day / 5 days / 1 month | 0.94% / -5.05% / 8.69% |
| Trend / MA-cross | sideways / none |
| SMA20 / SMA50 | 528.96 / 513.34 |
| RSI (14) / Stochastic %K | 47.9 / 8.4 |
| Bollinger %B / ATR | 43% / 16.71 |
| Support / Resistance 20 days | 505.00 / 555.90 |
| Data as of | 7 Agustus 2026 14:00 WIB |


