DBS RSI Overbought: Stock Gains 1.66% (Agustus 11, 2026)
On Agustus 11, 2026: price 76.33 SGD, trend uptrend, RSI 73.5, support 70.79, resistance 76.33. technical analysis of dbs stock. DBS RSI Overbought — full…

DBS Group’s shares on SGX touched SGD 76.33, up 1.66% on the day and 8.35% over the past month, with the stock now sitting at the top of its 3-month range. That matters because this is not just a quiet grind higher: the chart shows price pressing against the upper edge of its Bollinger band while volume is running above average, a combination that often tells traders the market is testing whether recent demand can extend into a fresh breakout or simply exhaust itself at a crowded level.
Trend & Price Action
The bigger picture still points upward. DBS is trading above its SMA20 at SGD 73.57 and well above its SMA50 at SGD 68.72, which means the shorter-term trend remains stronger than the medium-term trend. The uptrend is also supported by the SMA20 slope, which is rising at 1.98% over 5 days. In plain English, the average price over the past month is still climbing, not flattening out.
What makes the move more interesting is where price is standing now. The last price at SGD 76.33 is exactly at the reported 20-hour resistance of SGD 76.33 and also at the 3-month high of SGD 76.33. That is the kind of level where markets often decide whether momentum is strong enough to keep going or whether early buyers start taking profit.
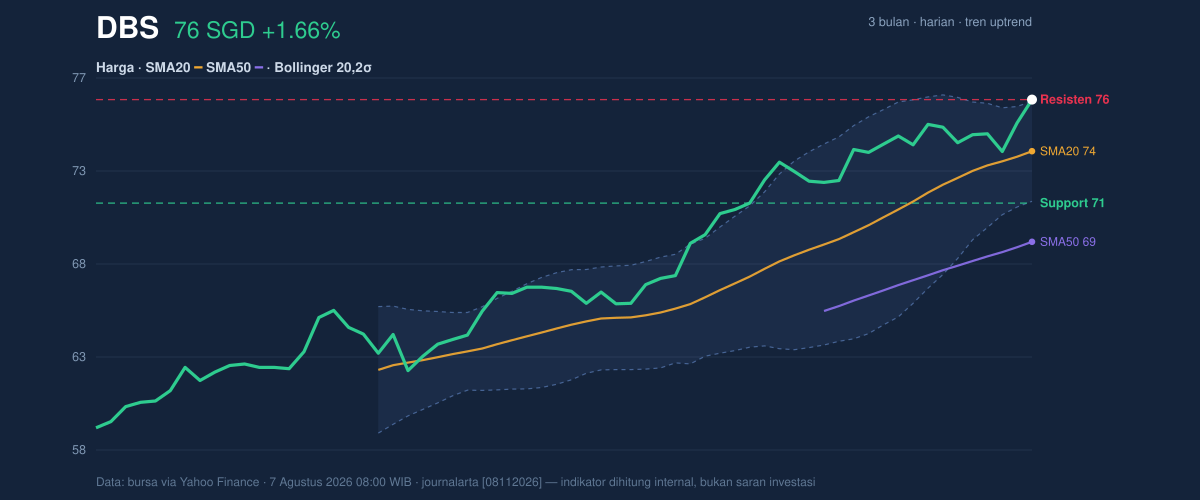
The Bollinger setup reinforces that tension. Price is above the upper band at SGD 76.24, with %B at 102%, which means the stock is trading just beyond the band rather than comfortably inside it. That usually signals strength, but it also warns that the move is stretched. The band width is only 7.3%, described as a squeeze, so the market has been compressing rather than expanding. When a squeeze meets a price that is already at the top of the range, it often sets up a sharp move — but not always in a straight line.
A short line says a lot here: DBS is strong, but it is also crowded at the top.
Oscillators & Momentum
The momentum gauges are not fully aligned with the price action, and that is the key signal in this report. The RSI at 73.5 is in overbought territory, while Stochastic %K at 100.0 and %D at 81.3 are also overbought. These readings do not mean the stock must fall; they mean the rally has moved fast enough that the market is vulnerable to pauses, pullbacks, or a period of sideways trade while it digests gains.
The more cautionary detail comes from MACD. The MACD at 1.906 is still positive, but it sits below the signal line at 2.021, leaving a negative histogram of -0.115. That combination tells us the trend is still up, yet the internal momentum has weakened. In other words, price is making new highs, but the pace of acceleration is not as strong as before. That is a classic early warning that a breakout attempt needs fresh volume confirmation.
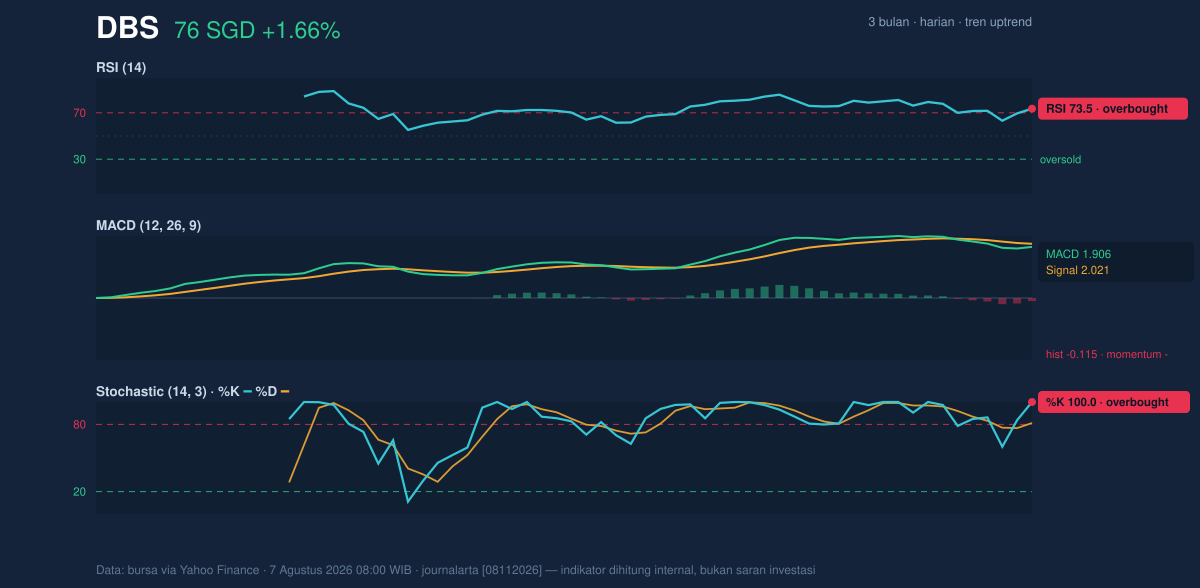
So the message from momentum is mixed: the trend is intact, but the oscillators are flashing “extended.”
Volatility & Volume
Volume is helping, at least for now. The latest session printed 6,786,400 shares, versus a 20-session average of 4,817,997, or about 1.4× normal. That is meaningful because a move into resistance on heavier participation is more credible than one built on thin trading. The OBV is rising as well, which suggests that money has been flowing into the stock rather than quietly leaving it.
Still, the volatility backdrop says the next move could be sharper than usual. The ATR at 1.20, or 1.6% of price, points to moderate daily movement. Combined with the Bollinger squeeze, that implies a market that has been coiling. When coiling happens near a high, the result can be a quick extension if resistance gives way — or a brisk snapback if the breakout fails.
The important nuance is that volume supports the trend, but momentum is no longer cleanly confirming it. That mismatch is often where short-term traders become more selective.
Key Levels & Scenarios
The immediate map is straightforward. The stock is testing resistance at SGD 76.33, with the next clearly defined downside reference at support 20h of SGD 70.79. Because price is already at the top of the reported range, the market is effectively asking whether it can convert resistance into support.
If DBS can hold above SGD 76.33 with continued volume, the chart would suggest an attempt to build on the breakout setup created by the Bollinger squeeze. If it fails to hold that level, the overbought RSI and Stochastic readings make a pullback toward the middle of the Bollinger structure more plausible. The middle band sits at SGD 73.57, which also matches the SMA20, so that area is the first technical “gravity point” below the current price.
The 3-month low at SGD 58.05 is far below current trade, which confirms how far the stock has already traveled. That distance itself matters: the market is no longer in a recovery phase; it is in a mature advance where new buyers are paying up near highs.
Technical Verdict: HOLD (wait & see)
HOLD (wait & see)
- RSI at 73.5 and Stochastic %K at 100.0 show the stock is overbought, so upside momentum is stretched.
- MACD histogram at -0.115 shows momentum is weakening even though the trend remains positive.
- Price at SGD 76.33 is pressing against resistance at SGD 76.33 and above the Bollinger upper band at SGD 76.24, so the chart needs confirmation, not assumption.
- Invalidation condition: this verdict is invalidated if price falls below SGD 70.79.
- Ideal Entry Range: SGD 73.57 to SGD 76.33
- Exit Target: SGD 76.33 on breakout confirmation, or the next move only if price can hold above that level
- Stop Loss protection: below SGD 70.79
For non-traders, that means DBS is strong, but the stock is now close enough to resistance that the next move needs proof, not just optimism.
“The market is asking for confirmation, not applause.”
Summary Data DBS
| Last price | 76.33 SGD |
| Change 1 day / 5 days / 1 month | 1.66% / 3.12% / 8.35% |
| Trend / MA-cross | uptrend / none |
| SMA20 / SMA50 | 73.57 / 68.72 |
| RSI (14) / Stochastic %K | 73.5 / 100.0 |
| Bollinger %B / ATR | 102% / 1.20 |
| Support / Resistance 20 days | 70.79 / 76.33 |
| Data as of | 7 Agustus 2026 08:00 WIB |



