HSBC Stock Analysis: Gains 0.34%, Momentum Weakens
On Agustus 11, 2026: price 1,526.40 GBp, trend sideways, RSI 53.7, support 1,462.00, resistance 1,597.40. technical analysis of hsbc stock.

HSBC Holdings was last traded at 1,526.40 GBp on the LSE, just above the prior close of 1,521.20, but the more important signal is not the day’s small gain: the share price is sitting below its SMA20 even as the broader structure remains sideways. That mix usually means the market is not rejecting the stock, but it is also not yet willing to pay up for it. The chart shows a name that is still inside a larger trading range, with buyers and sellers in near balance rather than a clean trend in control.
Trend & Price Action
The price is trading below the SMA20 at 1,529.11 while staying well above the SMA50 at 1,459.13. That positioning matters: the shorter average is the market’s near-term temperature, and slipping under it suggests recent momentum has cooled, even though the medium-term base is still intact. With no fresh MA-cross, there is no new trend confirmation from the moving averages. In plain English, the stock has not broken down, but it has also not proved it can extend higher from here.
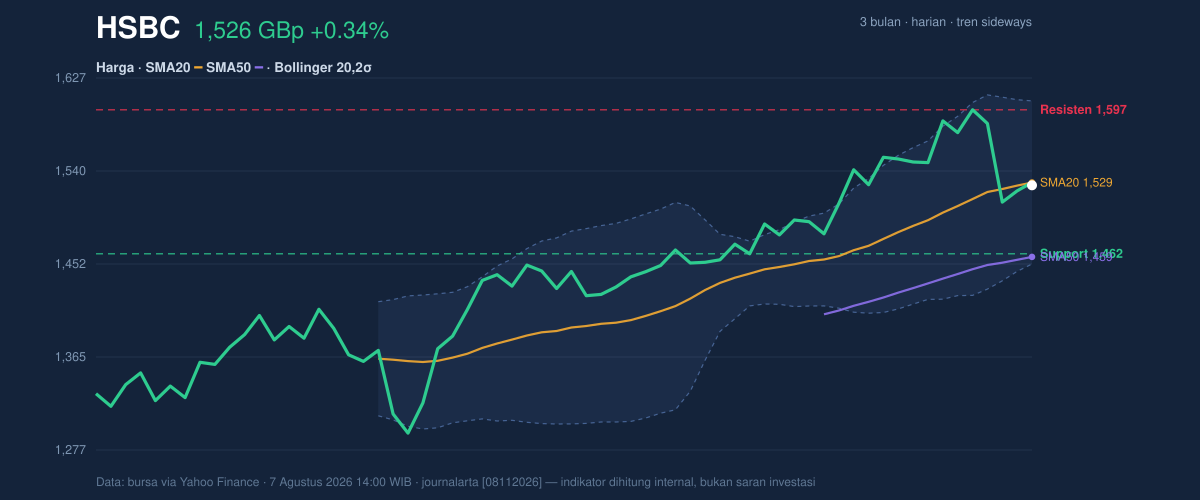
The wider setup is still constructive enough to avoid calling it a downtrend outright. HSBC is trading around 48% of the 20-day range, which places it near the middle rather than at an extreme. That is consistent with a market waiting for a catalyst. The stock also sits between the 3-month low of 1,267.20 and the 3-month high of 1,610.00, leaving room on both sides — but currently lacking the momentum to challenge the upper end cleanly.
A short move up, but not yet a breakout.
Oscillators & Momentum
The momentum picture is mixed, and that is where the signal becomes more nuanced. RSI at 53.7 is neutral, which means the stock is neither stretched nor washed out. That is important because neutral RSI often accompanies a consolidation phase: the market is pausing rather than forcing a direction. Stochastic %K at 40.2 and %D at 45.5 are also neutral, but with %K below %D, the short-term impulse is softer than the broader neutral read suggests. This is not an oversold rebound setup; it is more of a “wait for confirmation” pattern.
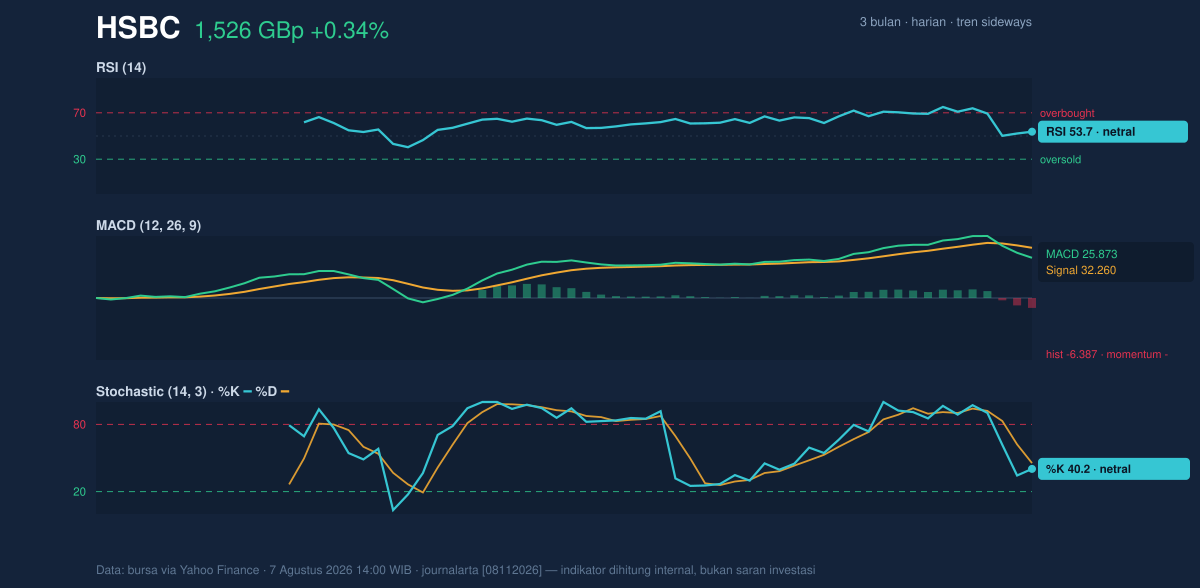
The clearest warning comes from the trend-following momentum indicator. MACD at 25.873 sits below its signal line at 32.260, and the histogram at -6.387 shows negative momentum. That matters because MACD is designed to capture whether the stock’s recent pace is improving or fading. Here it says the pace is fading. The message is not dramatic, but it is directional: the stock can still hold up on price, yet the internal momentum has not caught up.
Volatility & Volume
Volatility is present, but not explosive. ATR(14) at 38.20, or 2.5% of price, indicates a moderate daily swing range. That means moves can be noticeable, but not chaotic. Meanwhile, Bollinger Bands are in a normal 10.0% width configuration, which tells us the stock is not in a volatility squeeze that usually precedes a sharp expansion. The middle band at 1,529.11 lines up with the SMA20, reinforcing the idea that the stock is hovering around equilibrium rather than building a strong directional break.
The volume tape adds a more cautionary note. Volume of 100,547,660 was 3.7× the 20-day average, which is a real participation spike, but OBV is falling. OBV, or on-balance volume, tracks whether volume is supporting price advances or declines. When it trends lower while volume surges, it often means the heavier trading is not being absorbed as bullish accumulation. In other words, there is plenty of activity, but the activity is not clearly confirming strength.
High volume, weak confirmation.
Key Levels & Scenarios
The chart’s nearest reference points are clear. Support at 1,462.00 is the first level where buyers have previously shown up, while resistance at 1,597.40 is the first meaningful ceiling. Between those two levels, the stock is still range-bound. The Bollinger upper band at 1,605.80 sits just above resistance, so a move through the resistance zone would need to hold above both levels to look convincing. On the downside, the Bollinger lower band at 1,452.42 sits just under support, so a failure there would weaken the range structure and expose the lower part of the recent trading band.
The current technical picture is therefore less about a single number and more about whether HSBC can reclaim the short-term average and stay there. If it cannot, the market is likely to keep treating the stock as a sideways name with fading momentum rather than a fresh trend leader.
Technical Verdict: HOLD (wait & see)
HOLD (wait & see)
- Price is below SMA20 while MACD is below signal, showing short-term momentum has softened.
- RSI and Stochastic are neutral, so there is no oversold reset or strong breakout confirmation.
- Volume is elevated but OBV is falling, which suggests participation is not clearly supporting the move.
Verdict invalidated if price breaks below 1,452.42, because that would place the stock under the lower Bollinger band and weaken the current range structure.
- Ideal Entry Range: 1,462.00 to 1,529.11
- Exit Target (Target Price): 1,597.40 to 1,605.80
- Stop Loss protection: below 1,452.42
For non-traders, this means the stock is still standing, but it has not yet shown enough strength to leave its current trading band.
Summary Data HSBC
| Last price | 1,526.40 GBp |
| Change 1 day / 5 days / 1 month | 0.34% / -3.15% / 3.77% |
| Trend / MA-cross | sideways / none |
| SMA20 / SMA50 | 1,529.11 / 1,459.13 |
| RSI (14) / Stochastic %K | 53.7 / 40.2 |
| Bollinger %B / ATR | 48% / 38.20 |
| Support / Resistance 20 days | 1,462.00 / 1,597.40 |
| Data as of | 7 Agustus 2026 14:00 WIB |



