HSBC Stock Analysis: Gains 1.50%, Momentum Weakens
On Agustus 11, 2026: price 162.50 HKD, trend uptrend, RSI 56.0, support 152.60, resistance 168.20. technical analysis of hsbc stock. HSBC Stock Analysis — full…

At HKD 162.50, HSBC Holdings is still trading above its short- and medium-term trend markers, but the tape is no longer as clean as the price alone suggests. The share price finished 1.50% higher than the previous close, yet it also remains -3.39% over 5 days, a combination that points to a rebound inside a broader hesitation rather than a decisive breakout. As shown in the chart, the stock sits above SMA20 at 160.59 and well above SMA50 at 152.43, which keeps the structure in an uptrend; however, the lack of a fresh MA-cross and the softer momentum readings show that buyers have not fully reasserted control.
Trend & Price Action
The price structure is constructive, but only moderately so. Trading above both moving averages means HSBC is still holding the trend line that many chart watchers use to separate short-term strength from weakness. The SMA20 slope of 1.75% over 5 days signals that the near-term trend is still rising, which matters because a rising average often acts like a moving floor when the market is healthy. Yet the stock is not pressing into the top of its range: at 63% of the 20-hour range, it is mid-to-upper range rather than near a fresh high, and the 3-month high of 169.70 remains just overhead.
That positioning is important. It suggests the market has room to extend, but it has not yet proven that it can clear the prior ceiling.
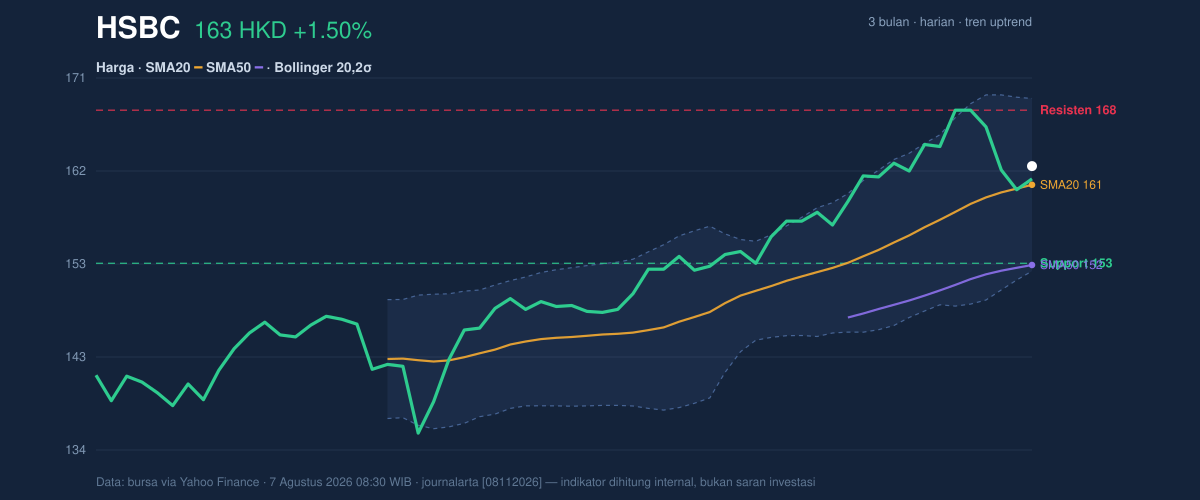
The nearby technical map is clear: support at 152.60 marks the first major line where the trend would start to look damaged, while resistance at 168.20 is the immediate barrier that has to be absorbed before the stock can challenge the 3-month high at 169.70. In practical terms, HSBC is still inside a rising channel, but it is approaching the area where rallies often stall unless volume and momentum improve.
Oscillators & Momentum
The oscillators are sending a more cautious message than the trend line. RSI at 56.0 is neutral, which means the stock is neither overbought nor oversold; it has enough room to move either way, but it is not flashing the kind of force that usually accompanies a strong upside breakout. The Stochastic %K at 40.1 and %D at 40.4 are also neutral, and because the two lines are almost on top of each other, the indicator is not signaling a strong directional edge. That usually means the market is waiting for a catalyst, not leading one.
The more telling signal is the MACD.
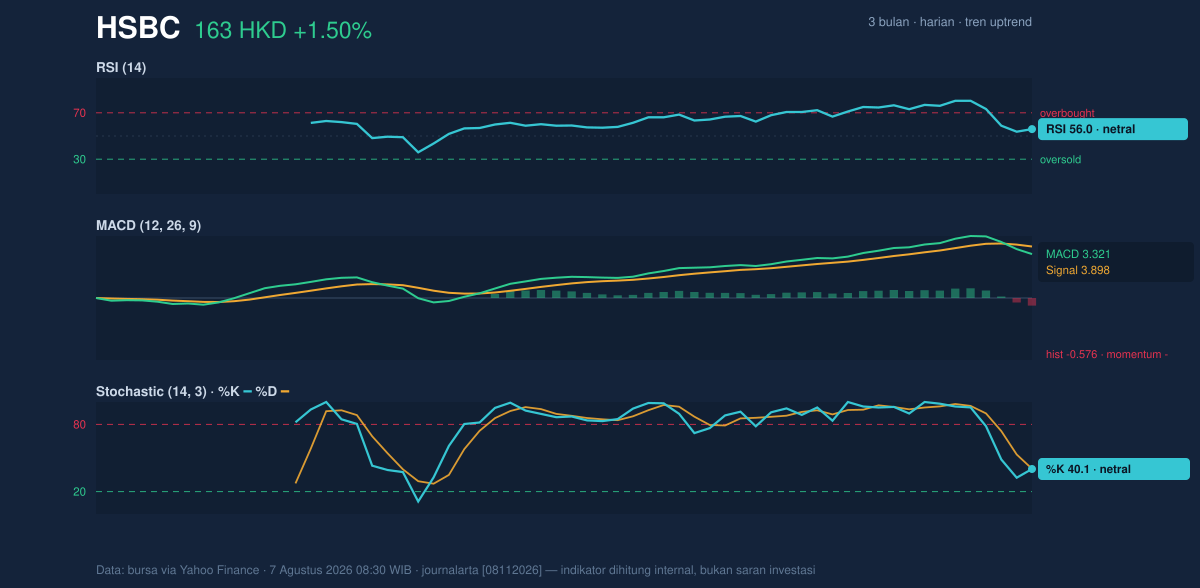
MACD at 3.321 sits below the signal line at 3.898, with a histogram of -0.576. In plain language, the trend may still be up, but the rate of ascent has slowed. MACD is a momentum gauge: when it falls below the signal line, it suggests the recent push higher is losing energy even if the price has not broken down yet. That divergence matters because it often shows up before a pause, consolidation, or a failed attempt at resistance.
Volatility & Volume
Volatility is contained rather than stretched. The Bollinger Bands are relatively normal, with a 11.0% band width and a %B of 61%. %B tells us where price sits inside the band structure: 61% means HSBC is above the middle line and leaning toward the upper half, but not riding the top band. The upper band at 169.39 is close to the chart’s resistance cluster, so the market is approaching a zone where upside progress may need stronger participation to continue. Normal band width also suggests there is no obvious squeeze waiting to explode; movement is possible, but not unusually compressed.
Volume is the real caution flag. Last turnover of 11,750,647 shares was only 0.8× normal versus the 20-hour average of 15,402,222, and OBV is down. On-balance volume tracks whether money is flowing into or out of a stock, so a declining OBV alongside a price that is still rising usually means the move is not being broadly confirmed. That does not automatically reverse the trend, but it does weaken the case that the latest bounce is powered by fresh demand.
The chart is showing price recovery without full participation.
That is usually a warning, not a verdict.
Key Levels & Scenarios
The key technical question is whether HSBC can convert its current position into a clean push through resistance. If 168.20 gives way with stronger volume, the stock would be testing the top of its recent structure and then the 169.70 3-month high, where sellers have already appeared before. If it fails there, the price may simply remain range-bound within the upper part of the Bollinger structure.
On the downside, 160.59 is the first line of defense because it is the SMA20 and the Bollinger middle band. A close below that would suggest the short-term trend is losing support. More importantly, a break toward 152.60 would put the stock back near the lower end of the recent range and would raise doubts about the durability of the uptrend.
Technical Verdict: HOLD (wait & see)
HOLD (wait & see)
- Price is still above SMA20 and SMA50, so the broader trend remains constructive.
- MACD is below its signal line and the histogram is negative, which shows fading momentum.
- Volume is 0.8× normal and OBV is down, so the latest bounce lacks strong participation.
Invalidation condition: this verdict is invalidated if price falls below 160.59, because that would mean HSBC has lost the SMA20 and the Bollinger midline together.
- Ideal Entry Range: 160.59 to 162.50
- Exit Target: 168.20 to 169.70
- Stop Loss protection: 152.60
In plain English, the stock is still trending higher, but the momentum and volume are not yet strong enough to confirm a clean breakout.
Summary Data HSBC
| Last price | 162.50 HKD |
| Change 1 day / 5 days / 1 month | 1.50% / -3.39% / 5.86% |
| Trend / MA-cross | uptrend / none |
| SMA20 / SMA50 | 160.59 / 152.43 |
| RSI (14) / Stochastic %K | 56.0 / 40.1 |
| Bollinger %B / ATR | 61% / 3.24 |
| Support / Resistance 20 days | 152.60 / 168.20 |
| Data as of | 7 Agustus 2026 08:30 WIB |



