OCBC RSI Overbought: Stock Gains 3.31% (Agustus 11, 2026)
On Agustus 11, 2026: price 30.30 SGD, trend uptrend, RSI 72.6, support 27.48, resistance 30.30. technical analysis of ocbc stock. OCBC RSI Overbought — full…

OCBC Bank’s shares on SGX climbed to 30.30 SGD, up from 29.33, and the move pushed the stock to the top of its short-term range, as shown in the chart. The advance is not just a one-day pop: the stock has risen 3.31% over one day, 4.02% over five days, and 10.46% over one month, a pattern that signals persistent buying rather than a brief reaction. At the same time, the technical picture is becoming stretched, which matters because strong trends can continue even as momentum starts to cool.
Trend & Price Action
The broader structure remains constructive. OCBC is trading above SMA20 at 28.88 and well above SMA50 at 26.40, which tells traders the stock is not merely bouncing but staying in a medium-term uptrend. The SMA20 slope of 2.21% over five days reinforces that the shorter trend is still rising, while the lack of a new MA-cross suggests the move is being driven by continuation rather than a fresh technical breakout signal.
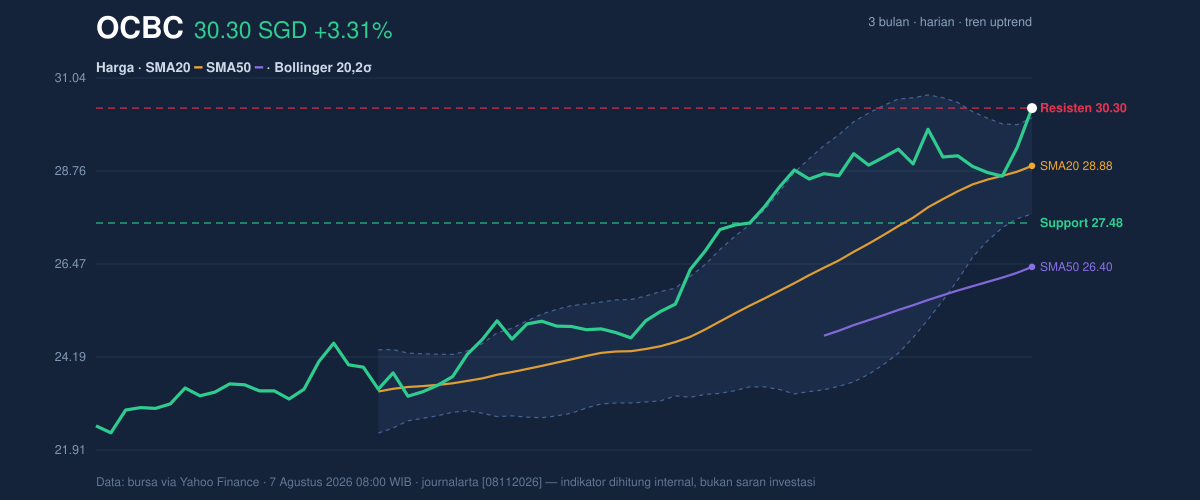
The price sitting at 100% of the 20-day range is important. It means the market has already used up the available room inside that recent band and is now testing whether demand can keep extending the move. The stock is also just below its 3-month high of 30.50, so the latest trading is pressing against an area where previous advances have begun to stall. That does not automatically mean reversal, but it does mean the next push higher will need fresh participation.
Oscillators & Momentum
The momentum gauges are flashing a mixed message, and that tension is often where the market becomes interesting. RSI at 72.6 and Stochastic %K at 91.1 / %D at 62.2 both sit in overbought territory, which means the stock has risen fast enough that short-term enthusiasm is elevated. In plain language, the market is no longer cheap on a momentum basis; it is extended.
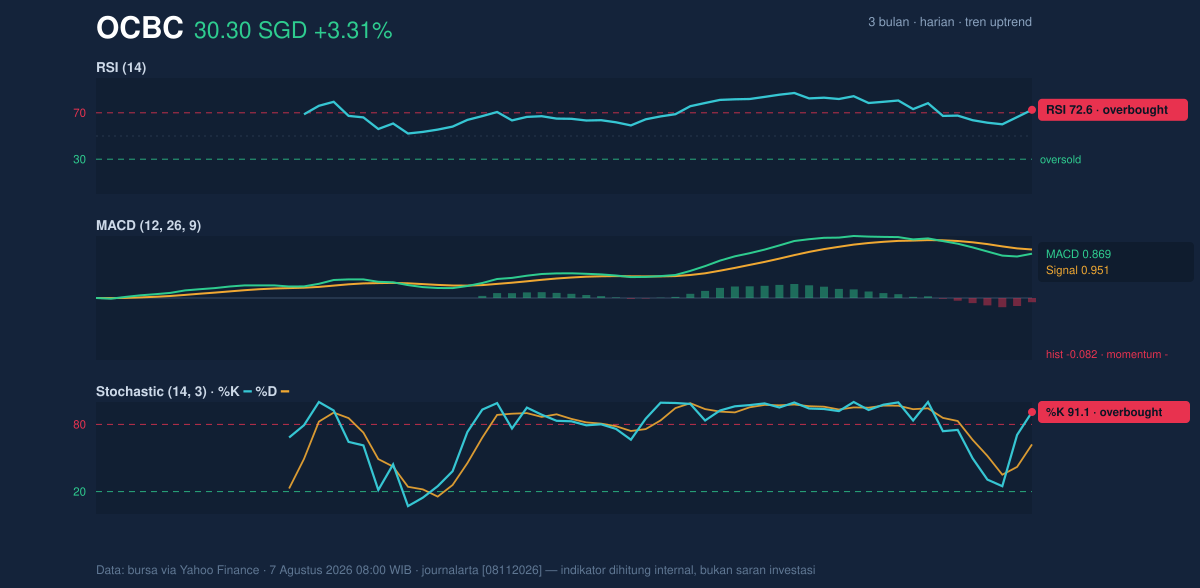
But the MACD is less supportive. MACD at 0.869 remains above zero, which keeps the broader trend intact, yet it is below the signal line at 0.951 and the histogram at -0.082 is negative. That combination often signals that upward momentum is still present, but it is losing some force. In other words, the trend is not broken, but the pace of the advance is no longer accelerating.
Volatility & Volume
Bollinger Bands add another layer to that message. The stock is trading above the upper band at 30.06, with %B at 110%, which means price has moved beyond the normal envelope of recent trading. That is a sign of strength, but also of extension; when a stock closes outside the upper band, it often reflects strong demand, though it can also precede consolidation as traders lock in gains. The Bollinger band width of 8.2% is normal, not compressed, so this is not a volatility squeeze waiting to break. Instead, the market is already in motion.
Volume confirms that the move has real participation. The latest turnover of 12,029,000 shares is about 1.8× the 20-day average of 6,833,945, and OBV is rising. That matters because rising price on heavier-than-usual volume usually indicates institutional or broad-based support rather than a thin, easily reversed move. The ATR of 0.62, or 2.0% of price, suggests daily swings are moderate, so the stock may not be wildly unstable even as it presses into overbought territory.
Key Levels & Scenarios
The nearest technical floor is the 20-day support at 27.48, while immediate overhead resistance is effectively the current print at 30.30, with the next visible ceiling at the 3-month high of 30.50. Because price is already at the top of the recent range, the market is in a decision zone: either it consolidates to work off overbought readings, or it clears the prior peak and opens a cleaner trend extension.
If 30.50 gives way on sustained volume, the chart would confirm that the stock has absorbed the overbought condition without losing momentum. If instead price slips back below 28.88, the 20-day average, that would suggest the latest breakout attempt is failing and the trend is cooling faster than the moving averages imply. A deeper loss of 27.48 would be more serious, because it would break the short-term support that has contained the advance.
Technical Verdict: HOLD (wait & see)
HOLD (wait & see)
- RSI at 72.6 and Stochastic %K at 91.1 show the stock is overbought, so upside momentum is stretched.
- MACD histogram at -0.082 and MACD below its signal line point to fading momentum even though the trend remains positive.
- Price above SMA20 and SMA50, plus OBV rising on 1.8× volume, show the underlying uptrend is still intact.
Verdict invalidated if price falls below 27.48, the 20-day support.
- Ideal Entry Range: 28.88 to 27.48
- Exit Target: 30.50
- Stop Loss protection: below 27.48
In plain English, the stock still looks strong, but it is stretched enough that the next move matters more than the last one.
Summary Data OCBC
| Last price | 30.30 SGD |
| Change 1 day / 5 days / 1 month | 3.31% / 4.02% / 10.46% |
| Trend / MA-cross | uptrend / none |
| SMA20 / SMA50 | 28.88 / 26.40 |
| RSI (14) / Stochastic %K | 72.6 / 91.1 |
| Bollinger %B / ATR | 110% / 0.62 |
| Support / Resistance 20 days | 27.48 / 30.30 |
| Data as of | 7 Agustus 2026 08:00 WIB |



