Shell Stock Drops 0.51%, Momentum Weakens In Focus
On Agustus 11, 2026: price 3,298.00 GBp, trend uptrend, RSI 54.5, support 3,109.00, resistance 3,405.50. technical analysis of shell stock.

Shell plc slipped to 3,298.00 GBp on the London Stock Exchange on 7 August 2026, easing 0.51% on the day even as the broader pattern still points higher. The share is holding above its short- and medium-term moving averages, but the latest tape shows a market that is still constructive on trend and less convincing on momentum, with buyers no longer pressing as hard as they were a few sessions ago.
Trend & Price Action
The first signal is that Shell remains in an uptrend, helped by a rising SMA20 at 3,266.73 and a much lower SMA50 at 3,142.66. That matters because price sitting above both averages usually means the market is still rewarding the prevailing direction rather than fighting it. The gap between the short and medium averages also shows that the recent advance has already done some work; this is not a fresh breakout story, but a trend that has been in place long enough to attract both followers and profit-takers.
At 3,298.00, Shell is trading above the Bollinger midline, which is the same as the SMA20, and that places it in the upper half of its current band structure. As shown in the chart, the share is also around 64% of the way through its 20-day range from 3,109.00 support to 3,405.50 resistance. That positioning is important: it signals the market is still leaning upward, but it is not sitting close enough to resistance to claim a clean breakout, while also not weak enough to be testing deeper support.
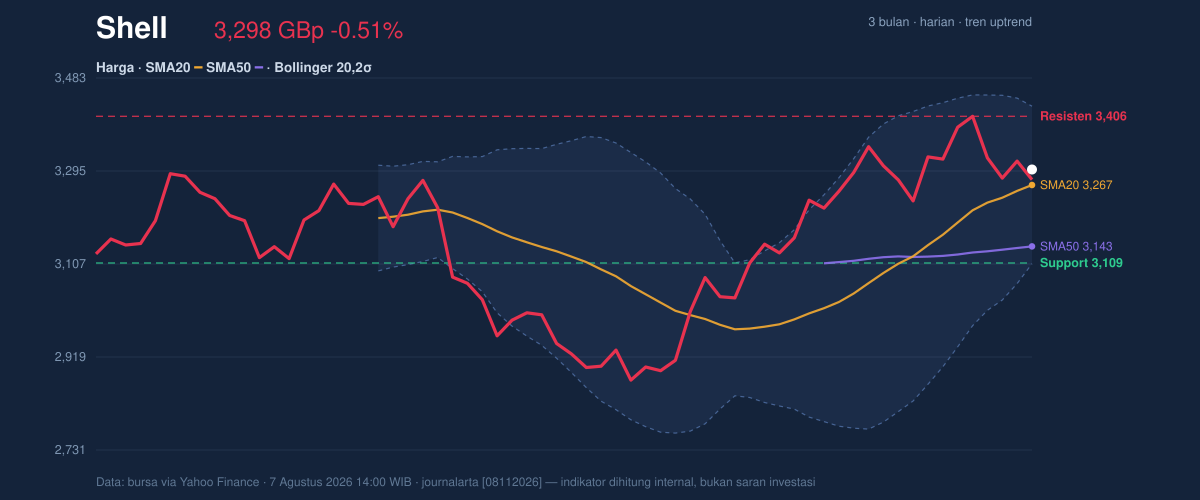
The broader 3-month range gives more context. Shell is well above the 3,109.00 support zone and still below the 3,758.50 high, which suggests there is room for continuation if momentum returns, but also that the stock has already moved far enough from its lows to make near-term consolidation unsurprising. The lack of a fresh MA-cross is not a problem on its own; it simply means the trend is being carried more by price staying above the averages than by a new moving-average signal.
Oscillators & Momentum
Momentum is where the picture becomes less straightforward. The RSI at 54.5 is neutral, which tells readers the stock is neither overbought nor oversold. In plain English, that means the market has not become stretched enough to force an immediate reversal, but it also lacks the kind of force that often accompanies a decisive breakout. The Stochastic %K at 32.5 and %D at 44.1 are also neutral, though they sit lower than RSI and hint that short-term price speed has cooled.
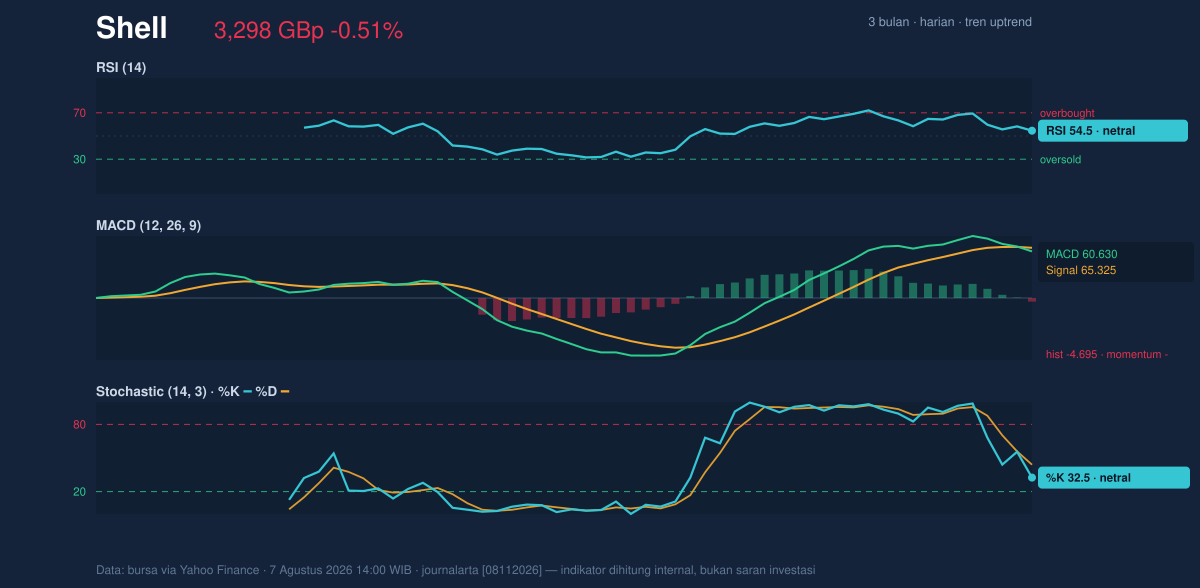
The clearest warning comes from MACD. Shell’s MACD at 60.630 remains above zero, but it is below the signal line at 65.325, leaving a -4.695 histogram. That combination means the longer trend has not broken, yet the recent push is losing pace. In technical terms, momentum is negative even while the broader trend stays positive, a setup that often leads to sideways trading or a test of nearby support before the next directional move. It is not a bearish collapse signal; it is a warning that the market may need fresh buying interest to keep climbing.
Volatility & Volume
The Bollinger Bands are telling a similar story. Band width is 9.7%, described as normal, so this is not a squeeze that usually precedes an explosive move, nor an expansion that would suggest a panic phase. Price at a %B of 60% means Shell is trading slightly above the mid-band and below the upper band at 3.425.76. That configuration often reflects a market that is still firm, but not yet energetic enough to challenge the top of the range with conviction.
Volume adds a useful cross-check. The latest turnover of 10,116,124 is only about 1.1× the 20-hour average of 9,376,373, so participation is modestly elevated rather than emphatic. More importantly, OBV is falling, which means volume flow has not fully confirmed the recent price structure. When a share can hold above support while OBV drifts lower, it often signals that rallies are being met by distribution — not necessarily heavy selling, but enough supply to blunt upside progress.
Shell’s ATR(14) of 73.30, equal to 2.2% of price, points to moderate daily movement. That matters because it suggests the stock can still travel meaningfully without entering a high-stress volatility regime. For traders reading the chart, that leaves room for a controlled move in either direction if one of the nearby levels gives way.
Key Levels & Scenarios
The immediate map is clear. 3,405.50 is the first resistance to watch, while 3,109.00 is the key support that has to hold to preserve the current structure. Above the market, the Bollinger ceiling at 3,425.76 is the next technical marker; it sits just beyond the 20-day resistance and would likely need stronger momentum and better volume confirmation to be tested cleanly. Below, the Bollinger lower band at 3,107.69 aligns closely with support, reinforcing that area as the line where the trend would start to look more fragile.
If Shell clears 3,405.50 and then holds above it, the chart would shift from range-trading to continuation mode, with the upper Bollinger band at 3,425.76 becoming the next reference point. If price fails to hold 3,109.00, the message changes quickly: the uptrend would still exist on longer averages, but short-term buyers would lose control and the market would likely revisit a lower part of the recent range.
Technical Verdict: HOLD (wait & see)
HOLD (wait & see)
- Price is above SMA20 and SMA50, which keeps the broader trend constructive.
- MACD histogram is negative, showing momentum has weakened even though trend remains intact.
- OBV is falling, so volume flow is not fully supporting the current price level.
- Verdict invalidated if price falls below 3,109.00, because that would break the key support and weaken the current uptrend structure.
- Ideal Entry Range: 3,109.00 to 3,266.73
- Exit Target: 3,405.50 to 3,425.76
- Stop Loss protection: below 3,107.69
For non-traders, this means Shell still looks steady, but the chart is asking for proof before the next move higher. “The trend is alive, but the market has stopped shouting.”
Summary Data Shell
| Last price | 3,298.00 GBp |
| Change 1 day / 5 days / 1 month | -0.51% / -2.53% / 8.54% |
| Trend / MA-cross | uptrend / none |
| SMA20 / SMA50 | 3,266.73 / 3,142.66 |
| RSI (14) / Stochastic %K | 54.5 / 32.5 |
| Bollinger %B / ATR | 60% / 73.30 |
| Support / Resistance 20 days | 3,109.00 / 3,405.50 |
| Data as of | 7 Agustus 2026 14:00 WIB |


