Singtel Stock Drops 0.92%, Testing Support Level In Focus
On Agustus 11, 2026: price 4.30 SGD, trend sideways, RSI 39.4, support 4.30, resistance 4.61. technical analysis of singtel stock. Singtel Stock Drops — full…

Singapore Telecom (Singtel) fell to SGD 4.30 on SGX in Singapore, slipping 0.92% from the previous close of SGD 4.34, and the move leaves the counter pressed against near-term support rather than testing higher ground. The chart, as shown in the price action view, suggests a market that is not trending decisively but is drifting lower inside a tightening range; that matters because a sideways tape with a weak bias often resolves only when price escapes the band, not while it sits in the middle of it.
Trend & Price Action
The broader structure is still best described as sideways, but the tone has softened. Singtel is trading below the SMA20 at SGD 4.43, while the SMA50 at SGD 4.39 sits just underneath price, which tells traders the stock is hovering in a narrow zone where short-term momentum has slipped but longer short-term trend support has not fully broken.
That setup is important because the market is not showing the clean momentum of a sustained uptrend or downtrend. Instead, the absence of a new MA-cross means the moving averages have not delivered a fresh directional signal, and the SMA20 slope of -0.19% over 5 days points to mild deterioration rather than a sharp selloff. In plain language, the stock is losing altitude slowly, not collapsing.
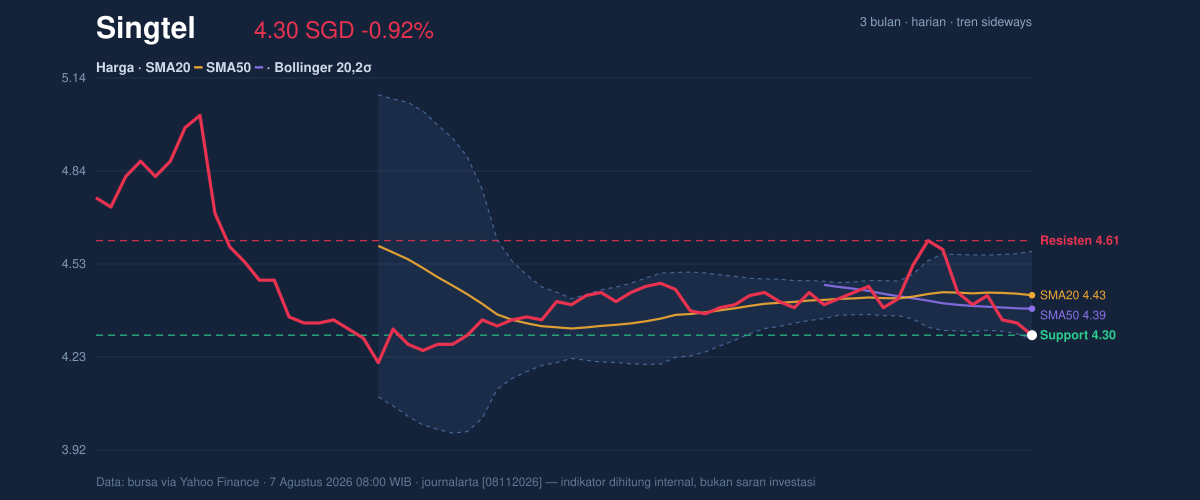
The price is also sitting at the 20-hour support of SGD 4.30, which is the same as the latest print. That is a meaningful line in the sand because price is at the 0% end of the 20-hour range, with resistance at SGD 4.61. The stock is therefore trading at the bottom of its recent band, and the market now has to decide whether this is a base or a prelude to another leg lower.
The broader three-month range adds context. Singtel’s 3-month high is SGD 5.05 and the 3-month low is SGD 4.15, so the current price is much closer to the lower end of that range than the upper end. That positioning usually signals caution: buyers have not yet regained control enough to challenge the upper half of the range.
Oscillators & Momentum
The momentum picture is mixed, but the balance still leans negative. The RSI(14) at 39.4 is technically neutral, which means the stock is not deeply oversold and not stretched on the upside either. That matters because neutral RSI near support can either mark a pause before a bounce or a halfway point in a down move; by itself, it does not force a reversal.
The stronger short-term clue comes from the stochastic oscillator. As shown in the momentum chart, Stochastic %K at 4.8 and %D at 4.3 are both in oversold territory. Oversold does not automatically mean “cheap” or “due to rise”; it means the stock has been closing near the bottom of its recent range for long enough that downside pressure may be stretched. In a sideways market, that can sometimes precede a rebound, but only if price actually holds support.
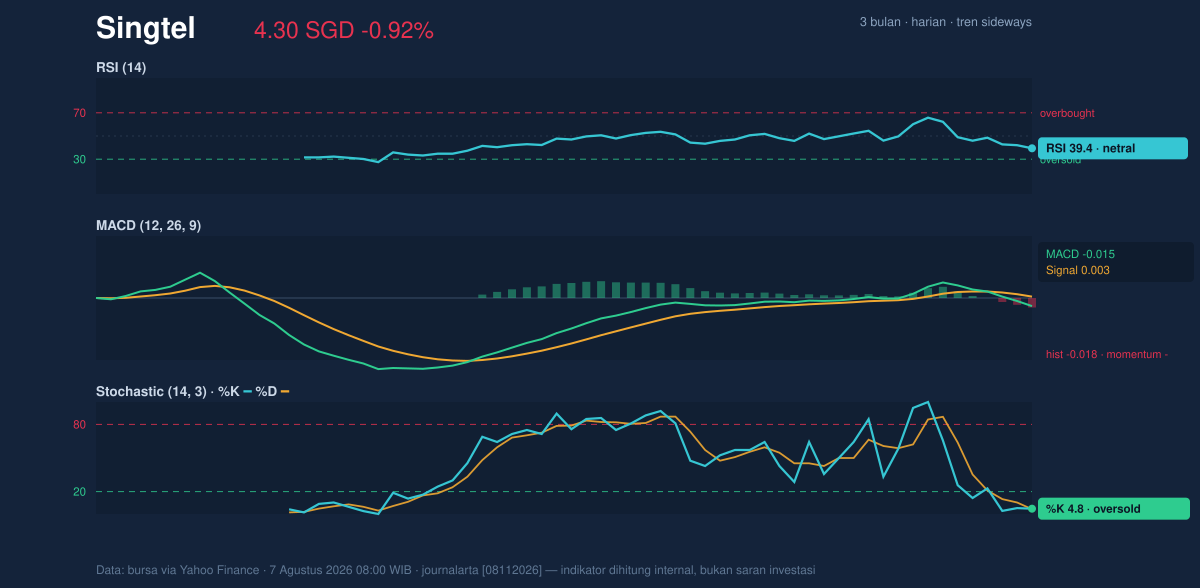
The MACD at -0.015 versus a signal line of 0.003, with a histogram of -0.018, is the clearest negative signal in the set. MACD measures whether shorter-term price action is outrunning longer-term action; here, it is not. The negative histogram shows bearish momentum is still in place, even if the move is not violent. Put simply, the stock is not yet showing a convincing turn higher.
Volatility & Volume
Volatility is contained but may be preparing to expand. The Bollinger Bands are relatively tight, with the upper band at SGD 4.57, middle band at SGD 4.43, and lower band at SGD 4.29, while the band width is 6.5%. That narrowing is a classic squeeze signal, which means the market has been compressing and a larger move could follow once price leaves the band.
The key detail is where price sits inside that structure: the latest price is just above the lower band at SGD 4.29 and far below the middle band. That positioning implies the market is leaning weak inside the squeeze, not building energy around the middle. If price can reclaim the mid-band around SGD 4.43, the tone improves; if it fails and slips below the lower band, the squeeze would likely resolve lower.
Volume does not yet confirm a strong reversal. Last volume was 29,689,500, below the 20-hour average of 32,177,085, or about 0.9× normal. That tells us participation was lighter than usual on the latest move, which weakens the case for a forceful breakout in either direction. The OBV is falling, and that is a quiet but important warning: on-balance volume tracks whether money is accumulating or leaving, and a downward OBV suggests sellers have had the upper hand even when price action looks contained.
Key Levels & Scenarios
The immediate map is straightforward. SGD 4.30 is the first support, followed by the lower Bollinger band at SGD 4.29. Those levels are close enough to matter together, and they form the first test of whether the current squeeze is holding. On the upside, SGD 4.43 is the mid-band and SMA20 area, while SGD 4.57 and then SGD 4.61 define the next resistance zone.
If price holds SGD 4.30 and reclaims SGD 4.43, the chart would start to look less fragile because the stock would be moving back through the middle of its recent range. If it fails to hold SGD 4.29-4.30, the squeeze would likely stop acting like a spring and start acting like a release valve to the downside. The 3-month low at SGD 4.15 is the next reference point if the lower band gives way.
Technical Verdict: HOLD (wait & see)
HOLD (wait & see)
- MACD remains negative, so the stock has not yet confirmed a momentum turn.
- Price is below the SMA20 and sitting at the lower Bollinger band, which shows weakness but also nearby support.
- Stochastic is oversold and Bollinger bands are squeezing, which raises the odds of a sharp move but not the direction.
Invalidation: this verdict is invalidated if price falls below SGD 4.29, because that would break the lower band and the nearest support.
- Ideal entry range: SGD 4.29 to SGD 4.43
- Exit target: SGD 4.57 to SGD 4.61
- Stop loss protection: below SGD 4.29
In plain English, the chart says Singtel is stuck near support, with weak momentum but enough compression to make the next move important.
Latest fact: the stock last traded at SGD 4.30, right on 20-hour support and just above the lower Bollinger band at SGD 4.29.
Summary Data Singtel
| Last price | 4.30 SGD |
| Change 1 day / 5 days / 1 month | -0.92% / -3.15% / -2.27% |
| Trend / MA-cross | sideways / none |
| SMA20 / SMA50 | 4.43 / 4.39 |
| RSI (14) / Stochastic %K | 39.4 / 4.8 |
| Bollinger %B / ATR | 4% / 0.09 |
| Support / Resistance 20 days | 4.30 / 4.61 |
| Data as of | 7 Agustus 2026 08:00 WIB |



