Tencent Stock Technicals Today: Gains 0.46%, Momentum Gains
On Agustus 11, 2026: price 481.40 HKD, trend uptrend, RSI 55.6, support 434.60, resistance 492.20. technical analysis of tencent stock.

Tencent Holdings rose on the Hong Kong exchange on 7 August as 0700.HK traded at HKD 481.40, up 0.46% from the previous close of HKD 479.20, with the shares sitting near the upper end of their recent range, according to exchange data cited via Yahoo Finance. The move keeps the stock in an established uptrend, but the signal is less about a breakout than about steady accumulation: price is above the key moving averages, momentum is positive, and volume remains below normal. That combination usually means the market is still constructive, though not yet in a rush.
Trend & Price Action
The clearest message from the chart is that Tencent remains in an uptrend, with the SMA20 at HKD 466.87 and the SMA50 at HKD 454.15. Price is trading above both, which tells readers the market has been willing to pay progressively higher levels over the past several weeks. The SMA20 slope of 1.15% over 5 days matters because a rising short-term average usually reflects persistent demand rather than a one-day headline reaction.
What is missing is a fresh moving-average crossover. That matters because a new “golden cross” — when a shorter average moves above a longer one — often marks a stronger trend phase. Here, the absence of a new cross suggests the trend is already established rather than just starting. In plain terms: the stock is not trying to prove itself; it is trying to hold its gains.
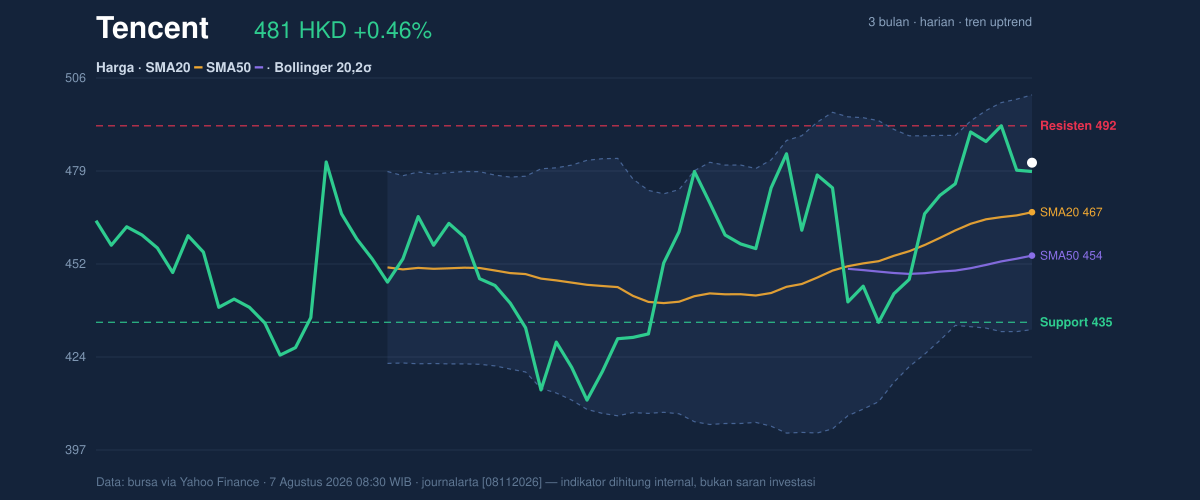
The price is also sitting at 81% of its 20-hour range, with support at HKD 434.60 and resistance at HKD 492.20. That positioning is important because it shows buyers have kept the stock closer to the top of the recent band than the bottom. The stock’s 3-month high of HKD 497.80 is now close enough to matter, while the 3-month low of HKD 411.00 remains well below current trading, reinforcing the idea that the market has moved out of the weaker phase.
A stock near resistance can stay strong; it can also pause.
Oscillators & Momentum
Momentum indicators are mostly aligned, but not stretched. The RSI(14) at 55.6 is neutral, which is a healthy reading in an uptrend because it suggests the stock is not yet overbought. The Stochastic %K at 71.1 and %D at 78.1 also sit in neutral territory, though they are edging higher, which hints that short-term buying pressure is still present. These readings do not scream chase; they say the move has room, but not much room for complacency.
The more persuasive signal comes from MACD. With MACD at 8.436 above the signal line at 6.253, and a histogram of 2.183, the trend momentum remains positive. For non-specialists, that means the faster price trend is still outrunning the slower one, a classic sign that upward momentum has not broken down. The key nuance is that the oscillator set is supportive rather than euphoric, which is often more sustainable than an overheated reading.
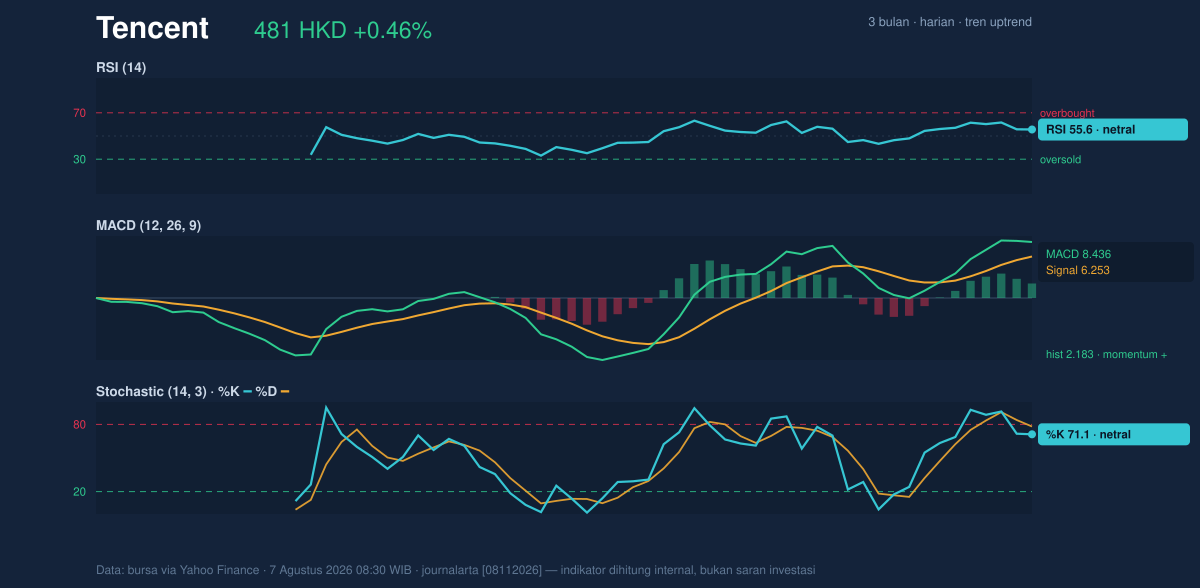
That balance matters. It says Tencent has momentum, but not the kind that usually ends in an immediate snapback.
Volatility & Volume
The Bollinger Band structure reinforces the same message. Price is trading with %B at 71%, meaning it is in the upper portion of the band but not pressing into a statistically extreme zone. The upper band at HKD 501.26 is the next technical ceiling, while the middle band at HKD 466.87 now acts as a reference line for trend health. The band width of 14.7% is described as normal, which suggests the market is not in a volatility squeeze that would typically precede a sharp expansion. In other words, the stock is moving in a controlled channel rather than a coiled spring.
The ATR(14) of 14.93, equal to 3.1% of price, points to moderate day-to-day movement. That is enough for meaningful swings, but not enough to imply disorder. It also helps explain why the stock can grind higher without dramatic spikes.
Volume, however, sends a more cautious note. The latest turnover of 16,319,939 is only 0.6x the 20-hour average of 29,305,214, so the advance is happening on quiet participation. That is not a bearish signal by itself, especially because OBV is rising, which means cumulative volume flow still favors buyers. But low volume on an upswing can also mean the market has not yet committed fully to a stronger leg higher.
Quiet volume, firm tape.
Key Levels & Scenarios
The immediate technical map is straightforward. HKD 492.20 is the first resistance to watch, and a sustained move through that area would put the HKD 497.80 3-month high back in play. Above that, the chart would be testing whether the current trend can transition from steady advance to a more forceful breakout. On the downside, HKD 466.87 — the SMA20 and Bollinger middle band — is the first important support, because a loss of that level would suggest the short-term trend is losing pace. Below that, HKD 434.60 is the more important structural support from the 20-hour range.
If price holds above the mid-band and keeps MACD positive, the trend remains intact. If it slips back under the SMA20 with weakening momentum, the market is telling us the recent climb has become less convincing.
Technical Verdict: HOLD (wait & see)
- Why: price remains above the SMA20 and SMA50, while MACD is positive and OBV is rising, which keeps the trend constructive.
- Why: RSI at 55.6 and Stochastic at 71.1 / 78.1 are supportive but not aggressive, suggesting the move is healthy rather than overheated.
- Why: volume is only 0.6x average, so the advance lacks strong participation even as price sits near the top of its range.
- Invalidation: this verdict is invalidated if price falls below HKD 466.87, where the short-term trend and Bollinger midline converge.
- Ideal Entry Range: HKD 466.87 to HKD 481.40
- Exit Target: HKD 492.20 to HKD 501.26
- Stop Loss Protection: below HKD 466.87, with deeper structural risk below HKD 434.60
For non-traders: Tencent is still trending up, but the chart says the next move needs stronger confirmation before the market shows its hand.
“The stock is holding its ground, but the real test is whether buyers show up again at the next resistance.”
Summary Data Tencent
| Last price | 481.40 HKD |
| Change 1 day / 5 days / 1 month | 0.46% / 1.30% / 4.61% |
| Trend / MA-cross | uptrend / none |
| SMA20 / SMA50 | 466.87 / 454.15 |
| RSI (14) / Stochastic %K | 55.6 / 71.1 |
| Bollinger %B / ATR | 71% / 14.93 |
| Support / Resistance 20 days | 434.60 / 492.20 |
| Data as of | 7 Agustus 2026 08:30 WIB |



