UOB Stock Technicals Today: Drops 0.64%, Momentum Weakens
On Agustus 11, 2026: price 43.30 SGD, trend sideways, RSI 56.5, support 42.47, resistance 44.95. technical analysis of uob stock. UOB Stock Technicals — full…

United Overseas Bank slipped to SGD 43.30 on SGX, down from SGD 43.58 in the previous session, and the move matters less for the size of the drop than for where it leaves the stock: just below its short-term average, with momentum cooling but not yet broken. The share has been drifting sideways, and that usually signals a market waiting for a catalyst rather than one that is already committed to a trend. In UOB’s case, the chart shows a stock sitting in the middle of its recent range, with traders watching whether the current pause resolves into a push through resistance or a retreat toward support.
Trend & Price Action
UOB is trading below its SMA20 at SGD 43.40 but well above its SMA50 at SGD 41.17, a setup that suggests the medium-term structure is still intact even as the near-term tone softens. That distinction matters: being under the 20-day moving average often means the latest price action is weaker than the recent trend, while staying above the 50-day average indicates the broader base has not been damaged. The trend is still described as sideways, and the SMA20 slope of 0.23% over 5 days points to a market that is not trending sharply in either direction.
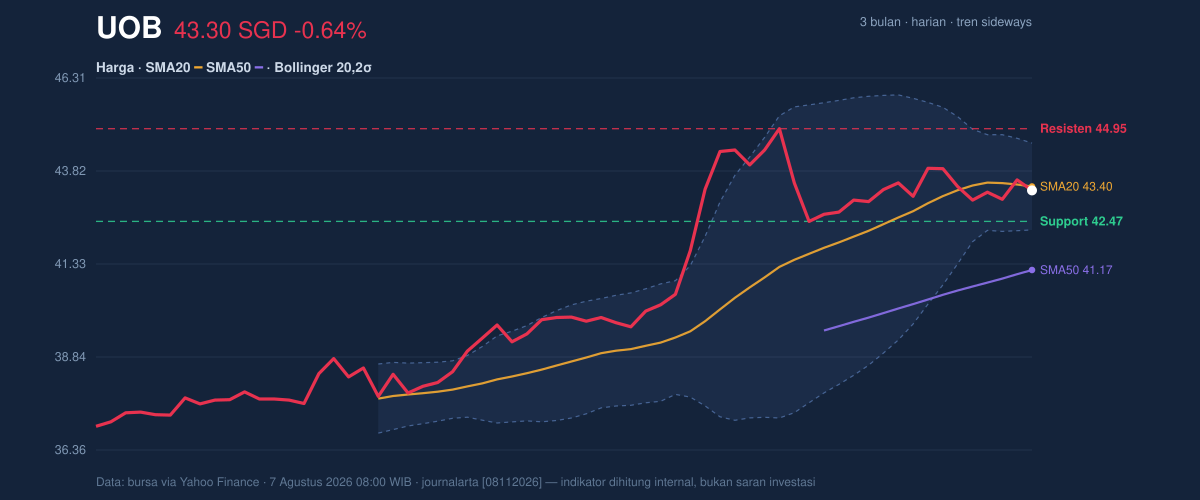
The price is also positioned at 33% of the 20-hour range, which tells us it is leaning toward the lower half of the recent band rather than pressing the top. That is not a collapse, but it does show that buyers have not yet managed to reclaim control after the latest slip. The broader three-month range, from SGD 36.65 to SGD 45.15, frames the current move as a mid-range consolidation rather than a breakout phase.
Oscillators & Momentum
The momentum signals are mixed, which is exactly what a sideways chart often produces. RSI at 56.5 is neutral, meaning the stock is neither overbought nor oversold and still has room to move in either direction without immediately looking stretched. Stochastic %K at 61.9 and %D at 67.0 also sit in neutral territory, but the fact that %K is below %D hints that short-term upward pressure has eased. In plain language, the stock has not lost all momentum, but the recent bounce is no longer accelerating.
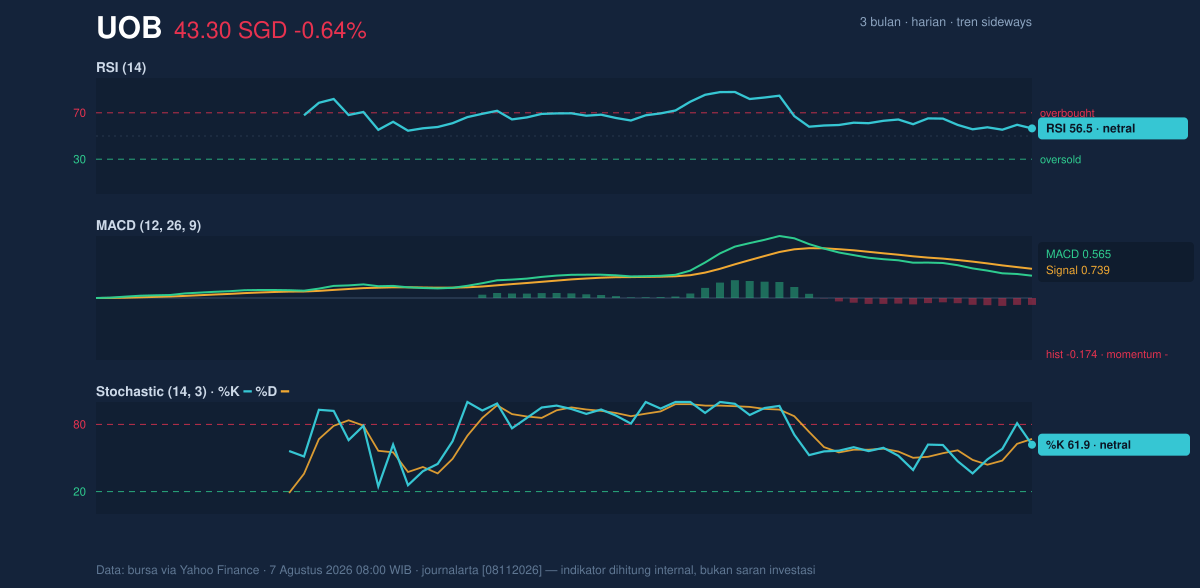
The more cautionary signal comes from MACD. MACD at 0.565 remains above zero, which means the longer trend has not flipped decisively bearish, yet it sits below the signal line at 0.739 and the histogram at -0.174 is negative. That combination usually means the stock is still in a constructive larger trend, but the latest price impulse is weakening relative to its recent average. For readers unfamiliar with the term, a negative histogram is often a sign that momentum is fading before price itself fully turns.
Volatility & Volume
The Bollinger Bands are tightening, with a band width of 5.3% and a note that the structure is squeezing. That matters because squeezes often precede larger moves: when volatility contracts, the market is storing energy rather than expending it. The current band levels place the upper boundary at SGD 44.56, the middle at SGD 43.40, and the lower at SGD 42.24. With %B at 46%, price is sitting slightly below the midpoint of the band, which reinforces the idea that UOB is neither extended nor deeply depressed.
Volatility itself is moderate, with ATR(14) at 0.73, or 1.7% of price. That suggests daily swings are present but not extreme, so any move out of the current range may still build gradually rather than in a disorderly surge. Volume adds another layer: the latest turnover of 6,542,300 shares was 1.8x the 20-day average of 3,543,178, which normally signals stronger participation. Yet OBV is down, and that divergence is important because it implies recent trading activity has not translated into sustained accumulation. In other words, volume rose, but the balance of participation still looks cautious.
Key Levels & Scenarios
The nearest support sits at SGD 42.47, while immediate resistance is SGD 44.95. These levels matter because they define the current battlefield inside the broader sideways structure. If UOB can reclaim the area above the 20-day average and then challenge the resistance zone, the squeeze in Bollinger Bands suggests the stock could move more quickly than recent trading has implied. If, however, price loses the lower support area, the chart would shift from consolidation to a more defensive posture.
The chart also shows the stock below the Bollinger middle line but above the lower band, which often describes a market that is still range-bound yet vulnerable if momentum continues to fade. The absence of a fresh MA cross means there is no new moving-average confirmation either way, so traders are left to read the levels themselves rather than a clean trend signal. That makes the support-resistance corridor especially important as the next directional test.
Technical Verdict: HOLD (wait & see)
HOLD (wait & see)
- RSI at 56.5 and Stochastic %K 61.9 / %D 67.0 are neutral, so there is no strong overbought or oversold signal.
- MACD histogram at -0.174 is negative, showing momentum is softening even though the broader trend has not fully broken.
- Bollinger Bands are squeezing with 5.3% width, which often precedes a move but does not yet confirm direction.
- Invalidation condition: verdict is invalidated if price breaks below SGD 42.47 and loses the nearby support zone.
- Ideal Entry Range: SGD 42.47 to SGD 43.40
- Exit Target: SGD 44.56 to SGD 44.95
- Stop Loss protection: below SGD 42.24
In plain English, UOB looks like a stock waiting for a clearer signal, not one that has already chosen its next direction.
Summary Data UOB
| Last price | 43.30 SGD |
| Change 1 day / 5 days / 1 month | -0.64% / -0.23% / -2.43% |
| Trend / MA-cross | sideways / none |
| SMA20 / SMA50 | 43.40 / 41.17 |
| RSI (14) / Stochastic %K | 56.5 / 61.9 |
| Bollinger %B / ATR | 46% / 0.73 |
| Support / Resistance 20 days | 42.47 / 44.95 |
| Data as of | 7 Agustus 2026 08:00 WIB |



