Alibaba Testing Key Resistance: Stock Gains 2.10% (Agustus 12, 2026)
On Agustus 12, 2026: price 126.40 HKD, trend uptrend, RSI 64.7, support 110.00, resistance 128.10. technical analysis of alibaba stock.

Alibaba Group’s Hong Kong-listed shares rose to HKD 126.40 on the HKEX on 10 August 2026, extending a short-term advance that has pushed the stock close to its 20-day resistance at HKD 128.10 and near the upper Bollinger band, according to exchange-based data via Yahoo Finance. The move leaves the chart in a constructive trend, but also in a stretched position: the price is already at 91% of its recent trading range, which means the market has done much of the near-term lifting and is now testing whether momentum can carry it through overhead supply.
Trend & Price Action
The broader structure remains positive. Alibaba is trading above both the SMA20 at HKD 117.27 and the SMA50 at HKD 111.52, a classic sign that short-term and medium-term buyers are still in control. The SMA20 is rising at 4.30% over five days, which matters because a rising moving average shows the recent trend is not just above average, but improving. In plain terms, the stock is not merely bouncing; it is being carried higher by a strengthening baseline.
There is, however, no fresh moving-average crossover to point to a new trend ignition. That matters because a new “golden cross” or “death cross” often acts as a catalyst for a stronger directional move. Without that, the current advance depends more on continued price follow-through than on a fresh technical trigger.
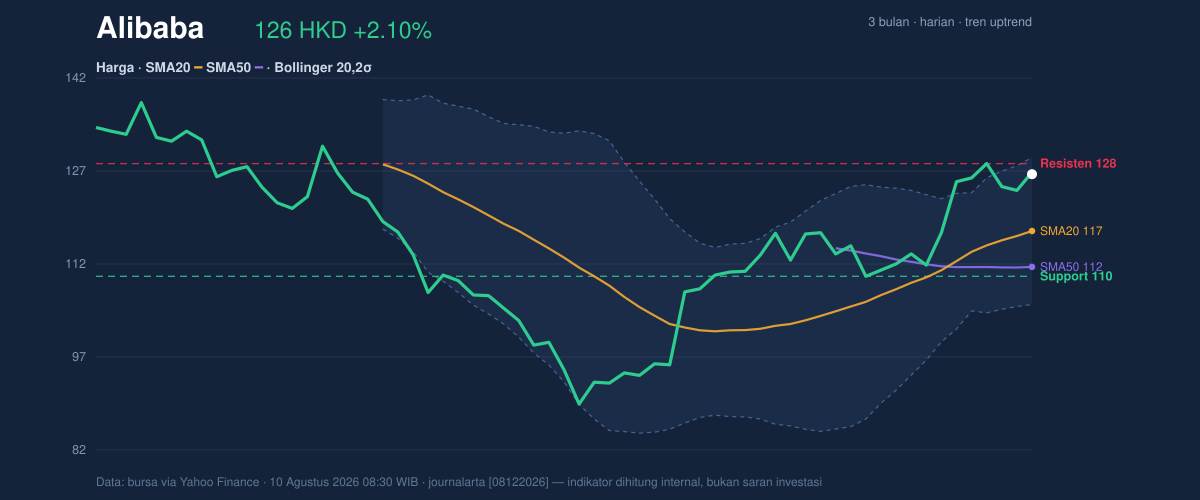
The chart also shows the stock trading near the top of its 3-month range, with the 3-month high at HKD 144.00 and 3-month low at HKD 88.65. That wide range tells readers the stock has already absorbed a large amount of volatility this year, and the current move is happening in the upper part of that band.
Strong trend. Near-term test.
Oscillators & Momentum
Momentum indicators are mixed, and that is the key nuance. The RSI at 64.7 is still in neutral territory, which suggests the stock is not yet in a classic overbought extreme. But the Stochastic reading of 88.1 / 79.8 is overbought, a signal that the latest push has moved quickly and may be vulnerable to pauses or pullbacks if buyers hesitate. Stochastic tends to react faster than RSI, so when it reaches elevated levels while price is near resistance, it often warns that the short-term move is getting crowded.
The MACD at 4.323, above its signal line at 3.029 with a positive histogram of 1.294, still argues that upward momentum is intact. The histogram is important because it shows the gap between the MACD line and its signal line; a positive reading means bullish momentum is still expanding, even if the stock is stretched in the short run.
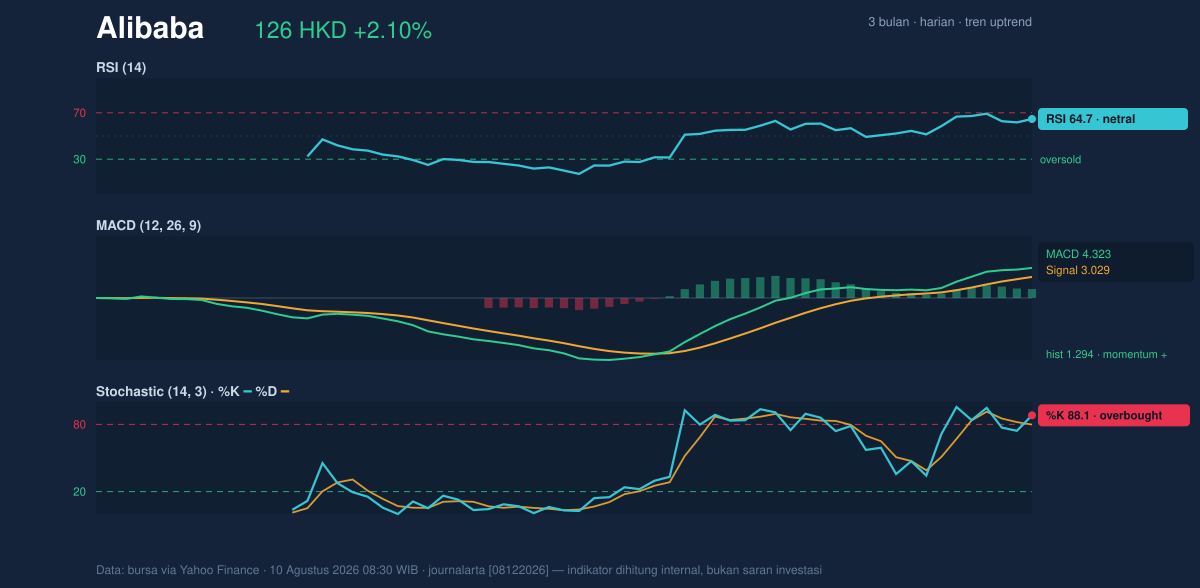
So the message from momentum is not “trend broken,” but “trend extended.” That distinction matters: the stock can remain strong while still being susceptible to a consolidation if buyers need time to digest gains.
Volatility & Volume
Volatility is elevated. The Bollinger Bands are widening, with the upper band at HKD 129.08, the middle band at HKD 117.27, and the lower band at HKD 105.46. A widening band usually signals that the market expects larger price swings rather than a quiet drift. With %B at 89%, the price is sitting close to the top of the band structure, which reinforces the idea that the stock is pressing into an area where short-term upside may become harder to sustain without fresh buying.
The ATR(14) at 4.76, or 3.8% of price, confirms that day-to-day movement is still fairly wide. ATR is a measure of average true range, and a higher reading means traders should expect larger intraday swings around the trend rather than smooth, straight-line progress.
Volume complicates the picture. Last session’s volume was 53,629,555, well below the 20-day average of 101,677,755, or about 0.5x normal activity. That is a warning sign for conviction: price is climbing, but participation is not matching the move. On the other hand, OBV is rising, which means the cumulative volume trend still leans supportive. In practical terms, the market is not showing distribution; it is showing a rally that has not yet been broadly confirmed by heavy turnover.
Quiet volume, loud chart.
Key Levels & Scenarios
The immediate technical battleground is clear. The stock has support at HKD 110.00 and resistance at HKD 128.10. Because the price is already near resistance and just below the upper Bollinger band at HKD 129.08, the next move matters more than the current one. If Alibaba can clear the HKD 128.10 area, the chart would open room toward the upper band and potentially toward the upper end of the recent range. If it fails there, the market may rotate back toward the SMA20 at HKD 117.27, which now acts as the first meaningful dynamic support.
The broader risk line sits at HKD 110.00. A loss of that level would matter because it would put price back into the lower half of the recent range and weaken the current uptrend structure.
Technical Verdict: HOLD (wait & see)
HOLD (wait & see)
- MACD remains positive, so the trend still has upward bias.
- Price is stretched near resistance with Stochastic overbought and %B at 89%, which raises the odds of consolidation.
- Volume is only 0.5x the 20-day average, so the breakout case lacks strong participation for now.
Verdict invalidated if price breaks below HKD 110.00.
- Ideal Entry Range: HKD 117.27 to HKD 110.00
- Exit Target: HKD 128.10 to HKD 129.08
- Stop Loss protection: below HKD 110.00
For non-traders: the chart still looks positive, but it is already close to resistance, so the next move is more likely to decide whether this rally continues or pauses.
Alibaba’s latest close was HKD 126.40, versus a 3-month high of HKD 144.00.
Summary Data Alibaba
| Last price | 126.40 HKD |
| Change 1 day / 5 days / 1 month | 2.10% / 0.96% / 14.18% |
| Trend / MA-cross | uptrend / none |
| SMA20 / SMA50 | 117.27 / 111.52 |
| RSI (14) / Stochastic %K | 64.7 / 88.1 |
| Bollinger %B / ATR | 89% / 4.76 |
| Support / Resistance 20 days | 110.00 / 128.10 |
| Data as of | 10 Agustus 2026 08:30 WIB |


